

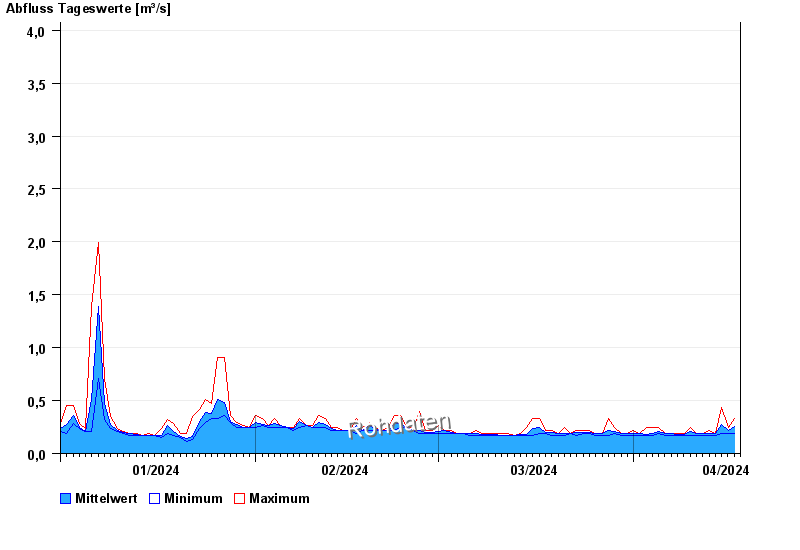
Chart of year Simbach / Simbach
Discharge from 01.01.2024 to 17.04.2024
 Für diesen Pegel sind keine Jährlichkeiten hinterlegt.
| Date | Mean value [m³/s] | Maximum [m³/s] | Minimum [m³/s] |
|---|---|---|---|
| 17.04.2024 | 0.203 | 0.216 | 0.192 |
| 16.04.2024 | 0.214 | 0.241 | 0.192 |
| 15.04.2024 | 0.264 | 0.395 | 0.192 |
| 14.04.2024 | 0.19 | 0.192 | 0.17 |
| 13.04.2024 | 0.192 | 0.216 | 0.17 |
| 12.04.2024 | 0.186 | 0.192 | 0.17 |
| 11.04.2024 | 0.191 | 0.192 | 0.17 |
© Bayerisches Landesamt für Umwelt 2024