
- Start >
- Rivers >
- Discharge >
- Inn >
- Schneizlreuth Weißbach >
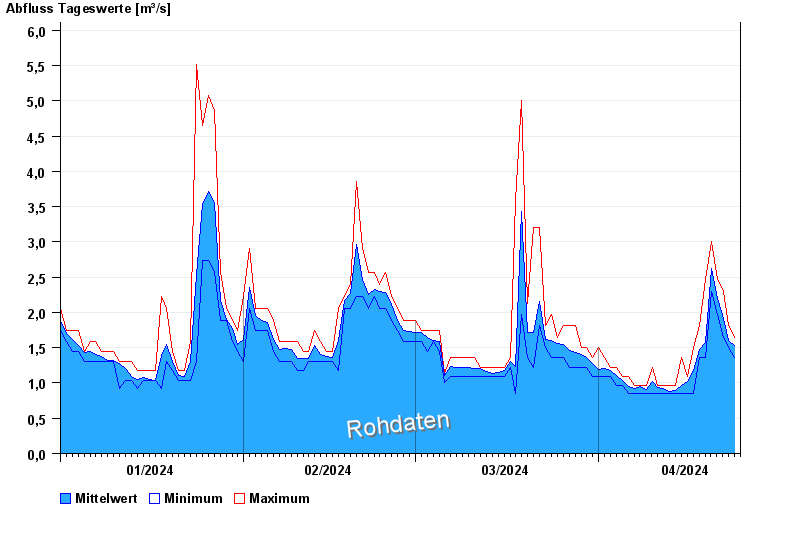
- Chart of year

Chart of year Schneizlreuth Weißbach / Weißbach
Discharge from 01.01.2024 to 24.04.2024
| Date | Mean value [m³/s] | Maximum [m³/s] | Minimum [m³/s] |
|---|---|---|---|
| 24.04.2024 | 1.55 | 1.65 | 1.5 |
| 23.04.2024 | 1.6 | 1.81 | 1.5 |
| 22.04.2024 | 1.91 | 2.3 | 1.65 |
| 21.04.2024 | 2.19 | 2.47 | 1.97 |
| 20.04.2024 | 2.62 | 3.01 | 2.3 |
| 19.04.2024 | 1.57 | 2.47 | 1.36 |
| 18.04.2024 | 1.47 | 1.81 | 1.36 |
© Bayerisches Landesamt für Umwelt 2024