
- Start >
- Rivers >
- Discharge >
- Inn >
- Schneizlreuth Weißbach >
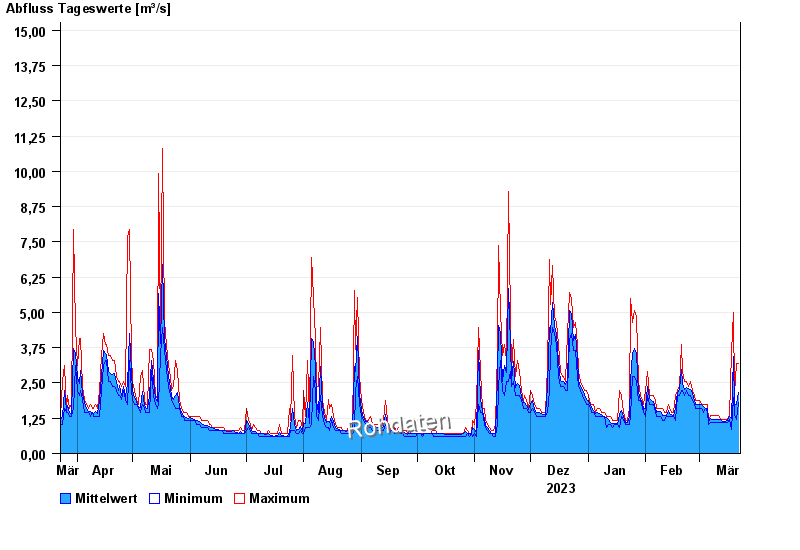
- Chart of year

Chart of year Schneizlreuth Weißbach / Weißbach
Discharge from 23.03.2023 to 22.03.2024
- 02.06.2013 Abfluss: 60,1 m³/s
- 26.06.1995 Abfluss: 55,7 m³/s
- 01.08.1977 Abfluss: 52 m³/s
- 07.08.1985 Abfluss: 47,2 m³/s
- 11.07.2005 Abfluss: 46,8 m³/s
| Date | Mean value [m³/s] | Maximum [m³/s] | Minimum [m³/s] |
|---|---|---|---|
| 22.03.2024 | 2.15 | 3.2 | 1.81 |
| 21.03.2024 | 1.72 | 3.2 | 1.22 |
| 20.03.2024 | 1.71 | 2.13 | 1.36 |
| 19.03.2024 | 3.43 | 5 | 1.97 |
| 18.03.2024 | 1.23 | 3.58 | 0.854 |
| 17.03.2024 | 1.3 | 1.36 | 1.22 |
| 16.03.2024 | 1.17 | 1.22 | 1.09 |
© Bayerisches Landesamt für Umwelt 2024