
- Start >
- Rivers >
- Discharge >
- Inn >
- Schneizlreuth Weißbach >
- Chart of year

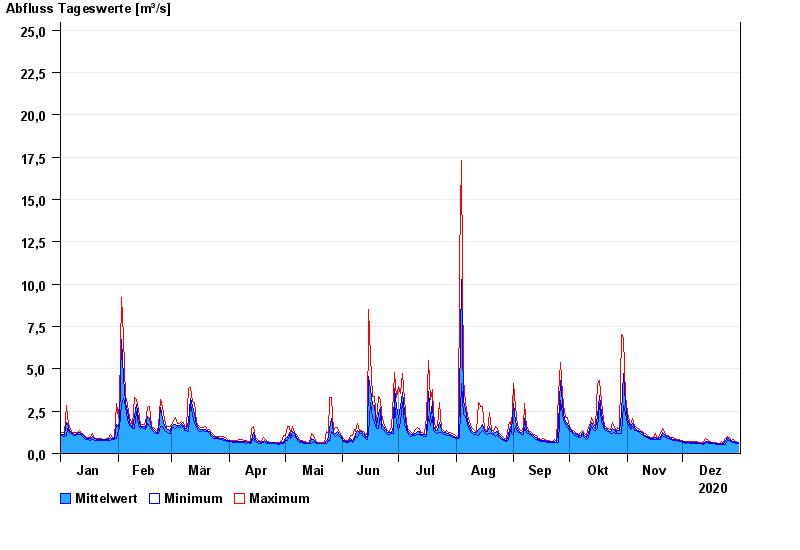
Chart of year Schneizlreuth Weißbach / Weißbach
Discharge from 01.01.2020 to 31.12.2020
- 02.06.2013 Abfluss: 60,1 m³/s
- 26.06.1995 Abfluss: 55,7 m³/s
- 01.08.1977 Abfluss: 52 m³/s
- 07.08.1985 Abfluss: 47,2 m³/s
- 11.07.2005 Abfluss: 46,8 m³/s
| Date | Mean value [m³/s] | Maximum [m³/s] | Minimum [m³/s] |
|---|---|---|---|
| 31.12.2020 | 0.628 | 0.671 | 0.584 |
| 30.12.2020 | 0.658 | 0.707 | 0.614 |
| 29.12.2020 | 0.691 | 0.746 | 0.633 |
| 28.12.2020 | 0.731 | 0.798 | 0.677 |
| 27.12.2020 | 0.75 | 0.795 | 0.701 |
| 26.12.2020 | 0.831 | 0.945 | 0.74 |
| 25.12.2020 | 0.936 | 1.01 | 0.829 |
© Bayerisches Landesamt für Umwelt 2024