
- Start >
- Rivers >
- Discharge >
- Inn >
- Schneizlreuth Weißbach >
- Chart of year

Chart of year Schneizlreuth Weißbach / Weißbach
Discharge from 21.09.2021 to 20.09.2022
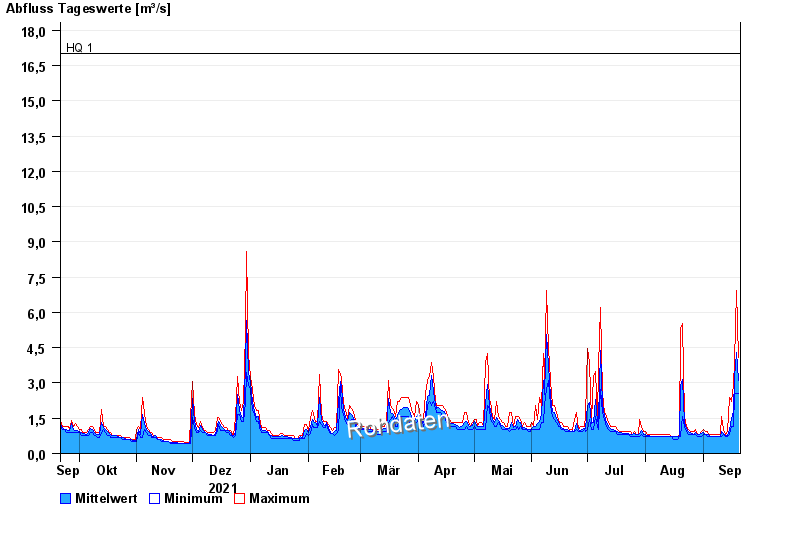
- HQ1 17 m³/s
- HQ2 22 m³/s
- HQ5 25 m³/s
- HQ10 33 m³/s
- HQ50 53 m³/s
- HQ100 63 m³/s
| Date | Mean value [m³/s] | Maximum [m³/s] | Minimum [m³/s] |
|---|---|---|---|
| 20.09.2022 | 3.12 | 4.07 | 2.56 |
| 19.09.2022 | 4.3 | 6.93 | 2.56 |
| 18.09.2022 | 3.25 | 3.87 | 2.56 |
| 17.09.2022 | 1.8 | 2.93 | 1.16 |
| 16.09.2022 | 1.48 | 2.22 | 1.16 |
| 15.09.2022 | 1 | 2.39 | 0.812 |
| 14.09.2022 | 0.769 | 0.921 | 0.711 |
© Bayerisches Landesamt für Umwelt 2024