
- Start >
- Rivers >
- Discharge >
- Inn >
- Rottersdorf >
- Chart of year

Chart of year Rottersdorf / Vils
Discharge from 16.07.2020 to 15.07.2021
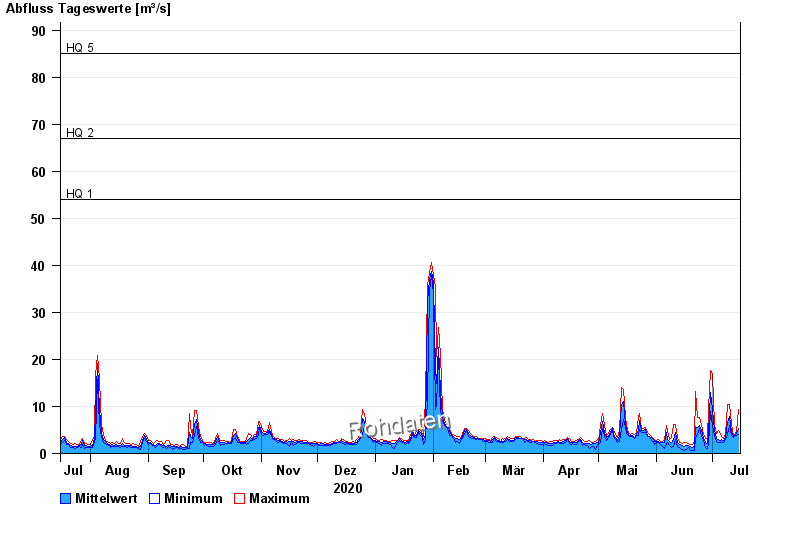
- HQ1 54 m³/s
- HQ2 67 m³/s
- HQ5 85 m³/s
- HQ10 98 m³/s
- HQ20 110 m³/s
| Date | Mean value [m³/s] | Maximum [m³/s] | Minimum [m³/s] |
|---|---|---|---|
| 15.07.2021 | 5.38 | 9.27 | 4.07 |
| 14.07.2021 | 4.18 | 4.67 | 3.88 |
| 13.07.2021 | 3.74 | 4.07 | 3.52 |
| 12.07.2021 | 3.61 | 3.88 | 3.36 |
| 11.07.2021 | 4.61 | 6.12 | 3.88 |
| 10.07.2021 | 7.93 | 10.4 | 5.85 |
| 09.07.2021 | 6.51 | 10.4 | 4.07 |
© Bayerisches Landesamt für Umwelt 2024