

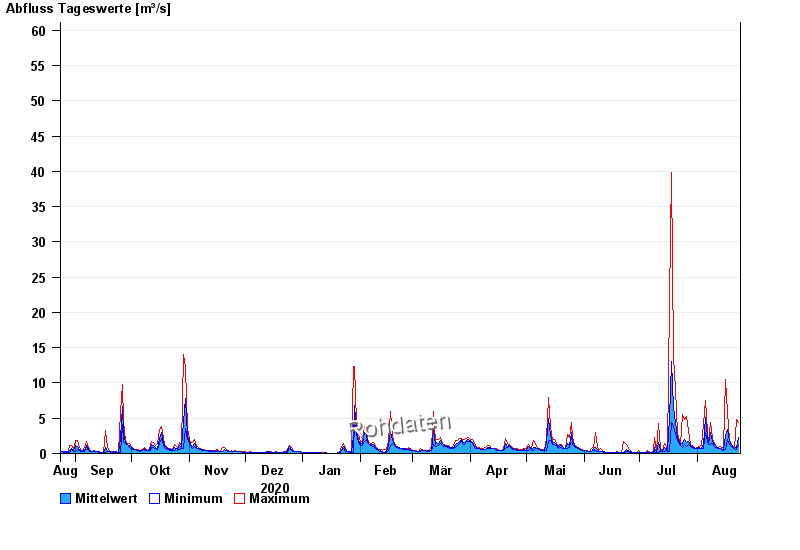
Chart of year Piding / Stoißer Ache
Discharge from 24.08.2020 to 23.08.2021
- 12.08.2002 Abfluss: 103 m³/s
- 08.07.1954 Abfluss: 86 m³/s
- 04.08.2020 Abfluss: 77,7 m³/s
- 26.06.1995 Abfluss: 77,6 m³/s
- 03.07.2009 Abfluss: 72,4 m³/s
| Date | Mean value [m³/s] | Maximum [m³/s] | Minimum [m³/s] |
|---|---|---|---|
| 23.08.2021 | 2.22 | 4.44 | 1.18 |
| 22.08.2021 | 0.891 | 4.87 | 0.529 |
| 21.08.2021 | 0.696 | 0.774 | 0.642 |
| 20.08.2021 | 0.918 | 1.04 | 0.774 |
| 19.08.2021 | 1.21 | 1.33 | 1.04 |
| 18.08.2021 | 1.71 | 1.96 | 1.33 |
| 17.08.2021 | 3.37 | 5.77 | 1.96 |
© Bayerisches Landesamt für Umwelt 2024