

Chart of year Piding / Stoißer Ache
Discharge from 24.08.2018 to 23.08.2019
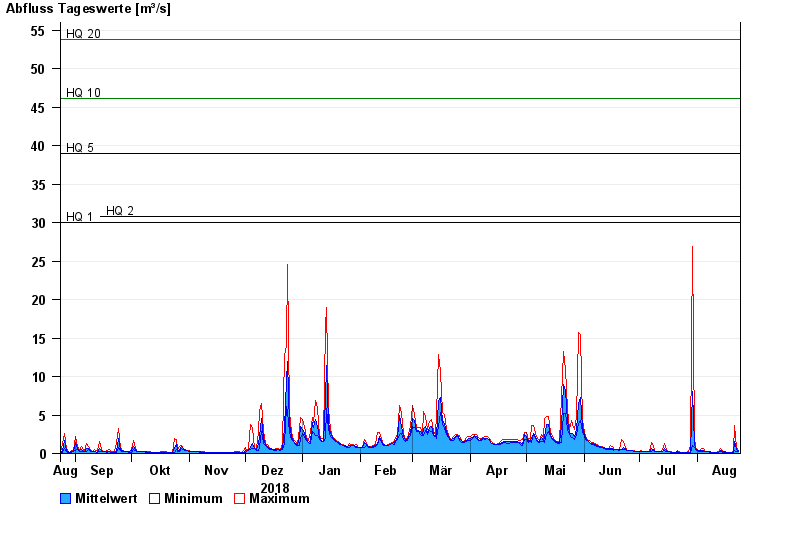
- HQ1 30 m³/s
- HQ2 30,8 m³/s
- HQ5 39 m³/s
- HQ10 46,1 m³/s
- HQ20 53,8 m³/s
- HQ50 66 m³/s
- HQ100 76,5 m³/s
| Date | Mean value [m³/s] | Maximum [m³/s] | Minimum [m³/s] |
|---|---|---|---|
| 23.08.2019 | 0.365 | 0.444 | 0.317 |
| 22.08.2019 | 0.543 | 0.781 | 0.317 |
| 21.08.2019 | 1.51 | 3.62 | 0.376 |
| 20.08.2019 | 0.194 | 0.376 | 0.155 |
| 19.08.2019 | 0.164 | 0.185 | 0.13 |
| 18.08.2019 | 0.157 | 0.185 | 0.155 |
| 17.08.2019 | 0.168 | 0.185 | 0.154 |
© Bayerisches Landesamt für Umwelt 2024