

Chart of year Piding / Stoißer Ache
Discharge from 24.08.2017 to 23.08.2018
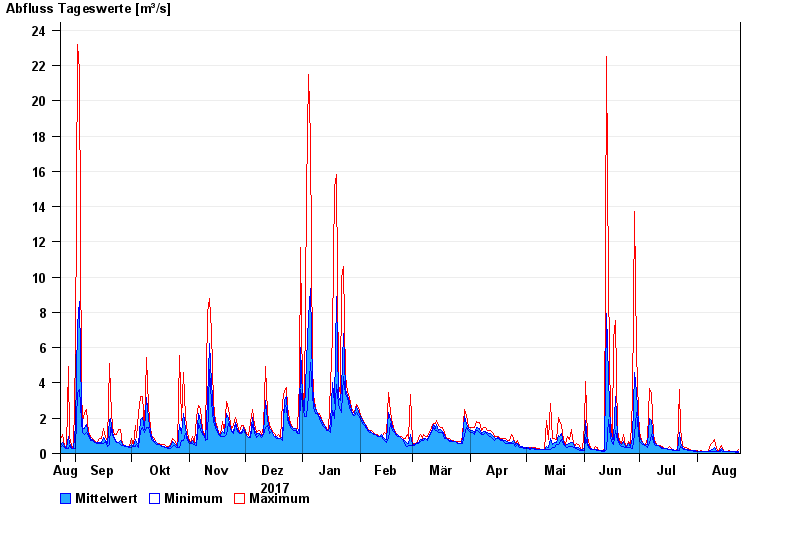
| Date | Mean value [m³/s] | Maximum [m³/s] | Minimum [m³/s] |
|---|---|---|---|
| 23.08.2018 | 0.095 | 0.231 | 0.08 |
| 22.08.2018 | 0.095 | 0.096 | 0.08 |
| 21.08.2018 | 0.099 | 0.113 | 0.095 |
| 20.08.2018 | 0.096 | 0.113 | 0.095 |
| 19.08.2018 | 0.095 | 0.095 | 0.095 |
| 18.08.2018 | 0.104 | 0.16 | 0.095 |
| 17.08.2018 | 0.112 | 0.113 | 0.095 |
© Bayerisches Landesamt für Umwelt 2024