

Chart of year Piding / Stoißer Ache
Discharge from 23.10.2020 to 22.10.2021
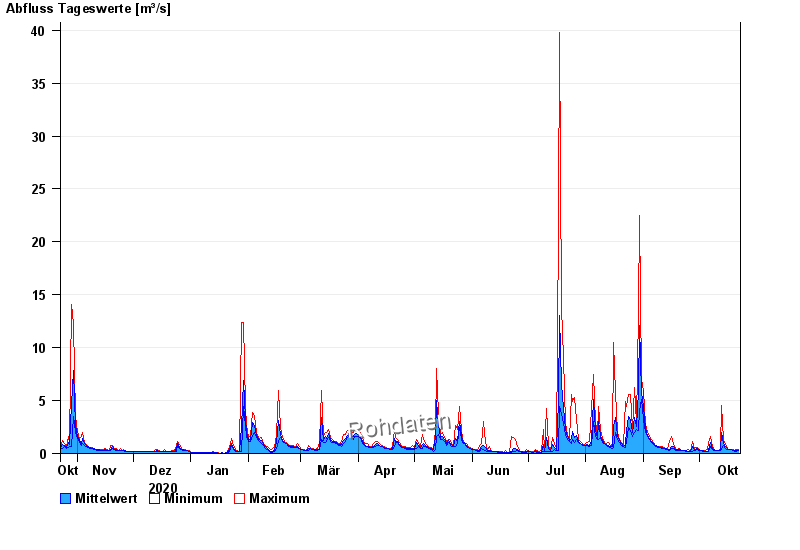
| Date | Mean value [m³/s] | Maximum [m³/s] | Minimum [m³/s] |
|---|---|---|---|
| 22.10.2021 | 0.274 | 0.406 | 0.27 |
| 21.10.2021 | 0.27 | 0.406 | 0.219 |
| 20.10.2021 | 0.269 | 0.27 | 0.219 |
| 19.10.2021 | 0.276 | 0.331 | 0.27 |
| 18.10.2021 | 0.331 | 0.331 | 0.331 |
| 17.10.2021 | 0.393 | 0.406 | 0.331 |
| 16.10.2021 | 0.466 | 0.497 | 0.406 |
© Bayerisches Landesamt für Umwelt 2024