

Chart of year Piding / Stoißer Ache
Discharge from 01.01.2020 to 31.12.2020
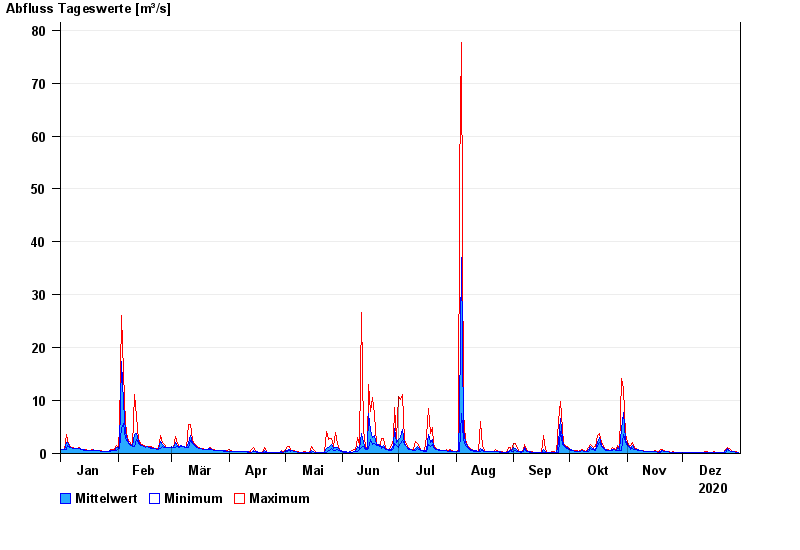
| Date | Mean value [m³/s] | Maximum [m³/s] | Minimum [m³/s] |
|---|---|---|---|
| 31.12.2020 | 0.232 | 0.249 | 0.21 |
| 30.12.2020 | 0.255 | 0.293 | 0.248 |
| 29.12.2020 | 0.307 | 0.346 | 0.292 |
| 28.12.2020 | 0.332 | 0.346 | 0.292 |
| 27.12.2020 | 0.375 | 0.482 | 0.344 |
| 26.12.2020 | 0.584 | 0.873 | 0.481 |
| 25.12.2020 | 0.971 | 1.11 | 0.762 |
© Bayerisches Landesamt für Umwelt 2024