

Chart of year Piding / Stoißer Ache
Discharge from 14.11.2019 to 13.11.2020
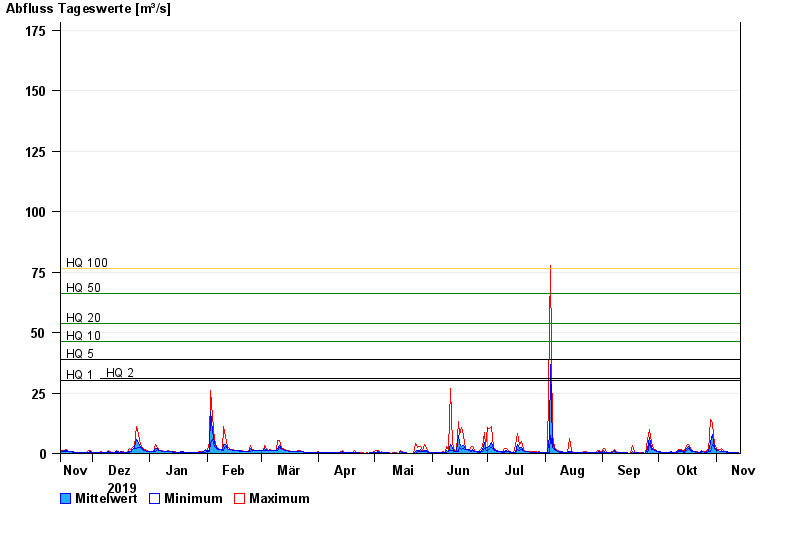
- HQ1 30 m³/s
- HQ2 30,8 m³/s
- HQ5 39 m³/s
- HQ10 46,1 m³/s
- HQ20 53,8 m³/s
- HQ50 66 m³/s
- HQ100 76,5 m³/s
| Date | Mean value [m³/s] | Maximum [m³/s] | Minimum [m³/s] |
|---|---|---|---|
| 13.11.2020 | 0.362 | 0.421 | 0.3 |
| 12.11.2020 | 0.4 | 0.42 | 0.299 |
| 11.11.2020 | 0.418 | 0.419 | 0.418 |
| 10.11.2020 | 0.453 | 0.492 | 0.416 |
| 09.11.2020 | 0.496 | 0.575 | 0.489 |
| 08.11.2020 | 0.57 | 0.574 | 0.489 |
| 07.11.2020 | 0.663 | 0.664 | 0.573 |
© Bayerisches Landesamt für Umwelt 2024