

Chart of year Piding / Stoißer Ache
Discharge from 01.01.2016 to 31.12.2016
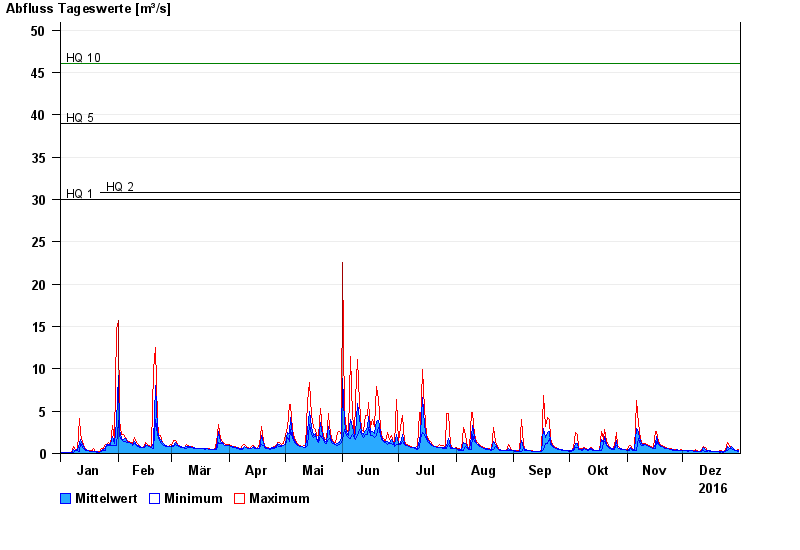
- HQ1 30 m³/s
- HQ2 30,8 m³/s
- HQ5 39 m³/s
- HQ10 46,1 m³/s
- HQ20 53,8 m³/s
- HQ50 66 m³/s
- HQ100 76,5 m³/s
| Date | Mean value [m³/s] | Maximum [m³/s] | Minimum [m³/s] |
|---|---|---|---|
| 31.12.2016 | 0.333 | 0.484 | 0.271 |
| 30.12.2016 | 0.397 | 0.404 | 0.333 |
| 29.12.2016 | 0.476 | 0.484 | 0.404 |
| 28.12.2016 | 0.547 | 0.572 | 0.484 |
| 27.12.2016 | 0.781 | 0.884 | 0.572 |
| 26.12.2016 | 0.639 | 0.77 | 0.572 |
| 25.12.2016 | 0.846 | 1.29 | 0.405 |
© Bayerisches Landesamt für Umwelt 2024