
- Start >
- Rivers >
- Discharge >
- Inn >
- Passau Ingling >
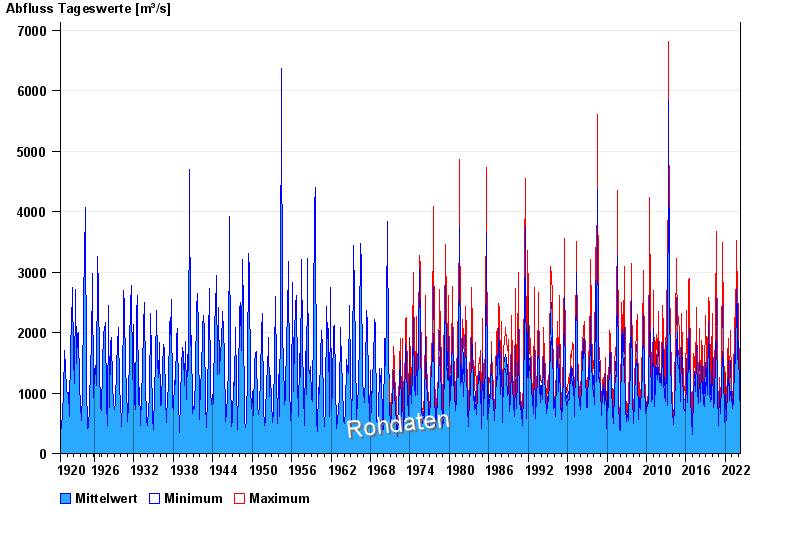
- Chart of total period

Chart of total period Passau Ingling / Inn
Discharge from 01.11.1920 to 23.04.2024
| Date | Mean value [m³/s] | Maximum [m³/s] | Minimum [m³/s] |
|---|---|---|---|
| 23.04.2024 | 655 | 696 | 634 |
| 22.04.2024 | 665 | 709 | 630 |
| 21.04.2024 | 674 | 709 | 634 |
| 20.04.2024 | 690 | 726 | 638 |
| 19.04.2024 | 710 | 770 | 654 |
| 18.04.2024 | 793 | 847 | 761 |
| 17.04.2024 | 848 | 931 | 779 |
© Bayerisches Landesamt für Umwelt 2024