
- Start >
- Rivers >
- Discharge >
- Inn >
- Passau Ingling >
- Chart of total period

Chart of total period Passau Ingling / Inn
Discharge from 01.11.1920 to 19.04.2024
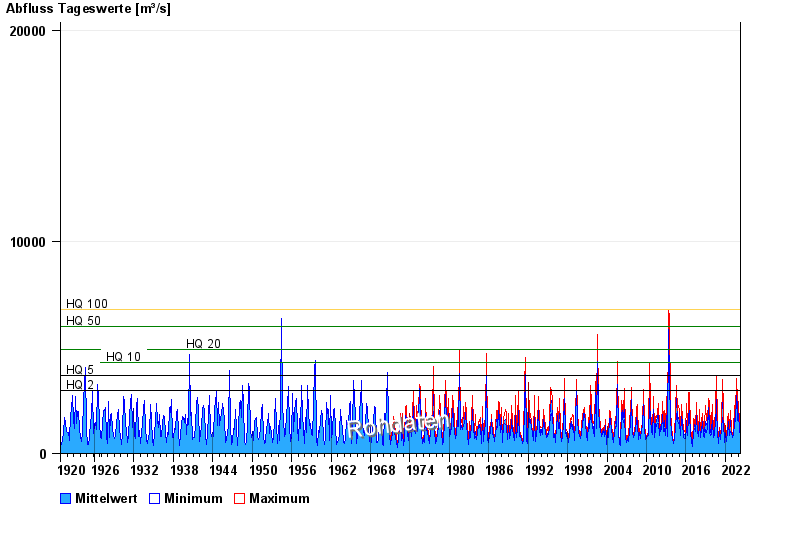
- HQ2 3000 m³/s
- HQ5 3700 m³/s
- HQ10 4300 m³/s
- HQ20 4900 m³/s
- HQ50 6000 m³/s
- HQ100 6800 m³/s
| Date | Mean value [m³/s] | Maximum [m³/s] | Minimum [m³/s] |
|---|---|---|---|
| 19.04.2024 | 768 | 770 | 761 |
| 18.04.2024 | 793 | 847 | 761 |
| 17.04.2024 | 848 | 931 | 779 |
| 16.04.2024 | 907 | 1020 | 810 |
| 15.04.2024 | 741 | 828 | 634 |
| 14.04.2024 | 628 | 688 | 599 |
| 13.04.2024 | 611 | 684 | 579 |
© Bayerisches Landesamt für Umwelt 2024