

Chart of year Panzing / Bina
Discharge from 29.01.2023 to 28.01.2024
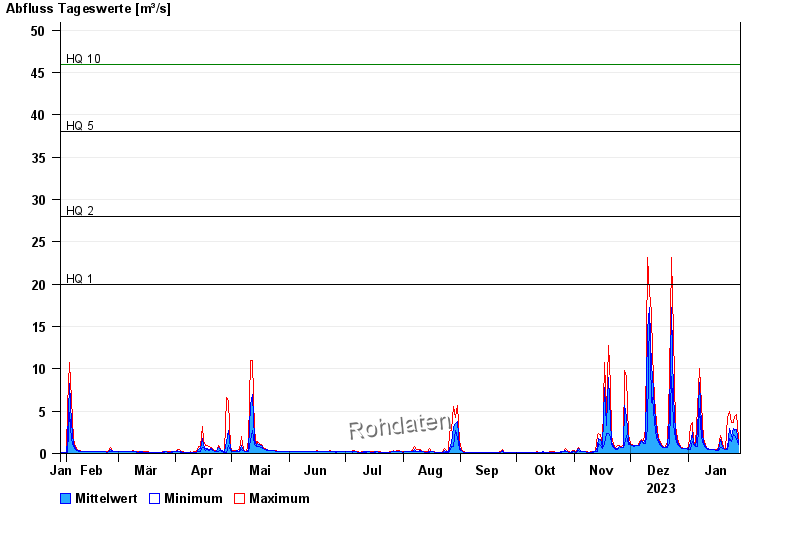
- HQ1 20 m³/s
- HQ2 28 m³/s
- HQ5 38 m³/s
- HQ10 46 m³/s
- HQ20 53 m³/s
- HQ50 64 m³/s
- HQ100 72 m³/s
| Date | Mean value [m³/s] | Maximum [m³/s] | Minimum [m³/s] |
|---|---|---|---|
| 28.01.2024 | 1.26 | 1.73 | 1.01 |
| 27.01.2024 | 2.84 | 4.59 | 1.73 |
| 26.01.2024 | 2.69 | 4.42 | 2.17 |
| 25.01.2024 | 2.98 | 3.62 | 2.28 |
| 24.01.2024 | 1.97 | 3.62 | 1.44 |
| 23.01.2024 | 2.96 | 4.92 | 1.73 |
| 22.01.2024 | 0.742 | 4.25 | 0.446 |
© Bayerisches Landesamt für Umwelt 2024