

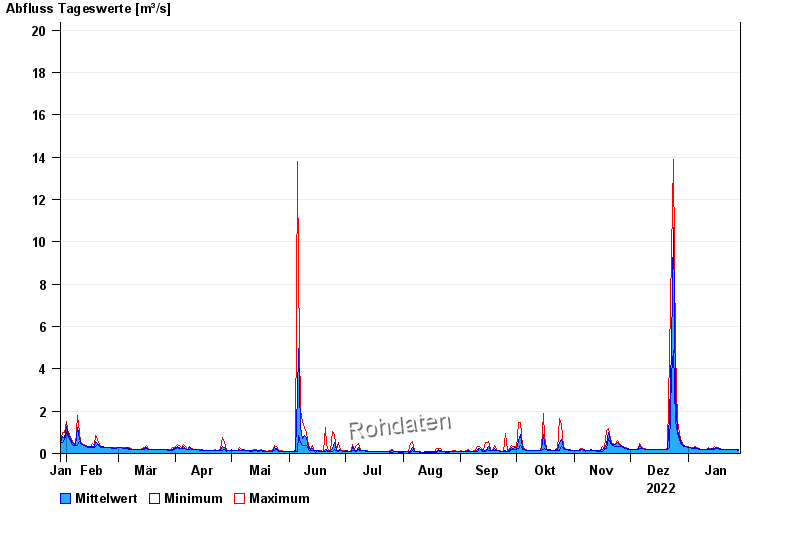
Chart of year Panzing / Bina
Discharge from 29.01.2022 to 28.01.2023
- 02.03.1987 Abfluss: 60,4 m³/s
- 13.01.2011 Abfluss: 53 m³/s
- 01.08.1991 Abfluss: 51,6 m³/s
- 22.02.1970 Abfluss: 49,6 m³/s
- 31.01.1982 Abfluss: 48 m³/s
| Date | Mean value [m³/s] | Maximum [m³/s] | Minimum [m³/s] |
|---|---|---|---|
| 28.01.2023 | 0.173 | 0.184 | 0.159 |
| 27.01.2023 | 0.184 | 0.184 | 0.184 |
| 26.01.2023 | 0.184 | 0.184 | 0.184 |
| 25.01.2023 | 0.184 | 0.184 | 0.184 |
| 24.01.2023 | 0.184 | 0.184 | 0.184 |
| 23.01.2023 | 0.184 | 0.184 | 0.184 |
| 22.01.2023 | 0.184 | 0.184 | 0.184 |
© Bayerisches Landesamt für Umwelt 2024