

Chart of year Panzing / Bina
Discharge from 29.01.2021 to 28.01.2022
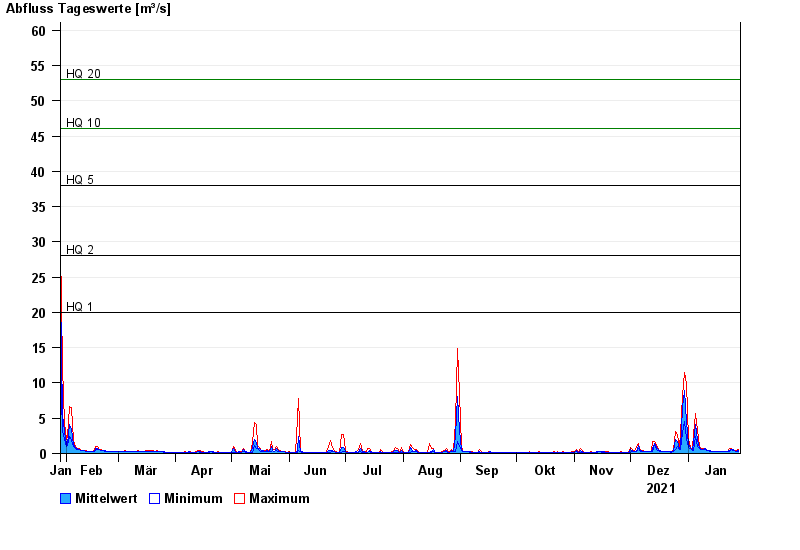
- HQ1 20 m³/s
- HQ2 28 m³/s
- HQ5 38 m³/s
- HQ10 46 m³/s
- HQ20 53 m³/s
- HQ50 64 m³/s
- HQ100 72 m³/s
| Date | Mean value [m³/s] | Maximum [m³/s] | Minimum [m³/s] |
|---|---|---|---|
| 28.01.2022 | 0.459 | 0.585 | 0.342 |
| 27.01.2022 | 0.354 | 0.384 | 0.342 |
| 26.01.2022 | 0.402 | 0.429 | 0.384 |
| 25.01.2022 | 0.506 | 0.585 | 0.429 |
| 24.01.2022 | 0.575 | 0.643 | 0.53 |
| 23.01.2022 | 0.439 | 0.643 | 0.303 |
| 22.01.2022 | 0.276 | 0.303 | 0.268 |
© Bayerisches Landesamt für Umwelt 2024