

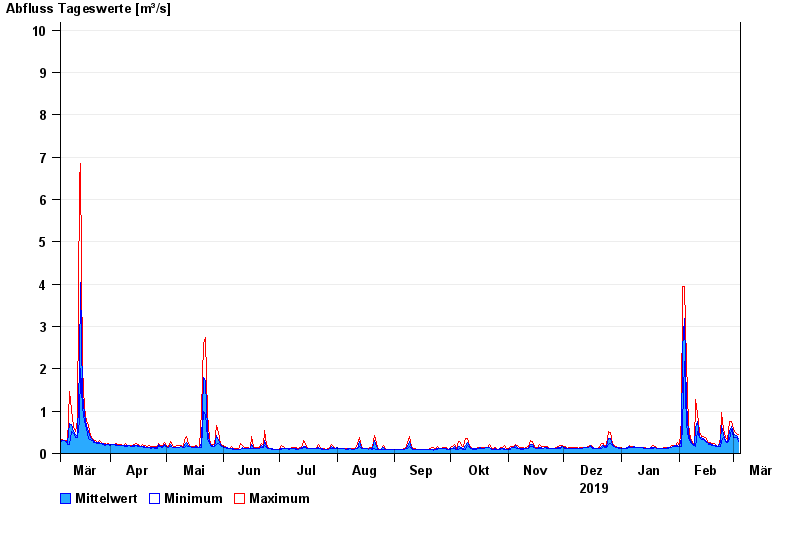
Chart of year Panzing / Bina
Discharge from 05.03.2019 to 04.03.2020
- 02.03.1987 Abfluss: 60,4 m³/s
- 13.01.2011 Abfluss: 53 m³/s
- 01.08.1991 Abfluss: 51,6 m³/s
- 22.02.1970 Abfluss: 49,6 m³/s
- 31.01.1982 Abfluss: 48 m³/s
| Date | Mean value [m³/s] | Maximum [m³/s] | Minimum [m³/s] |
|---|---|---|---|
| 04.03.2020 | 0.348 | 0.447 | 0.293 |
| 03.03.2020 | 0.415 | 0.464 | 0.372 |
| 02.03.2020 | 0.442 | 0.515 | 0.372 |
| 01.03.2020 | 0.454 | 0.569 | 0.371 |
| 29.02.2020 | 0.627 | 0.75 | 0.569 |
| 28.02.2020 | 0.509 | 0.75 | 0.33 |
| 27.02.2020 | 0.271 | 0.33 | 0.257 |
© Bayerisches Landesamt für Umwelt 2024