

Chart of year Panzing / Bina
Discharge from 05.03.2022 to 04.03.2023
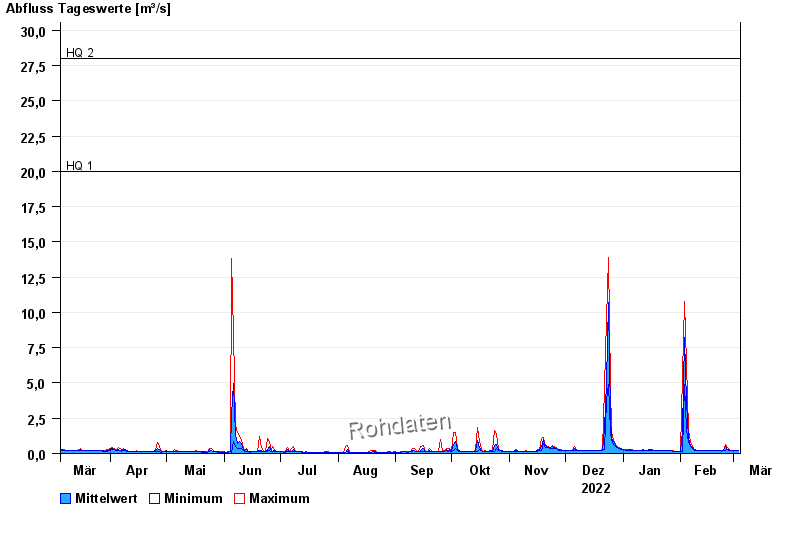
- HQ1 20 m³/s
- HQ2 28 m³/s
- HQ5 38 m³/s
- HQ10 46 m³/s
- HQ20 53 m³/s
- HQ50 64 m³/s
- HQ100 72 m³/s
| Date | Mean value [m³/s] | Maximum [m³/s] | Minimum [m³/s] |
|---|---|---|---|
| 04.03.2023 | 0.2 | 0.211 | 0.184 |
| 03.03.2023 | 0.206 | 0.211 | 0.184 |
| 02.03.2023 | 0.211 | 0.211 | 0.211 |
| 01.03.2023 | 0.21 | 0.211 | 0.184 |
| 28.02.2023 | 0.214 | 0.242 | 0.211 |
| 27.02.2023 | 0.255 | 0.275 | 0.242 |
| 26.02.2023 | 0.315 | 0.393 | 0.275 |
© Bayerisches Landesamt für Umwelt 2024