

Chart of total period Panzing / Bina
Discharge from 01.11.1961 to 18.04.2024
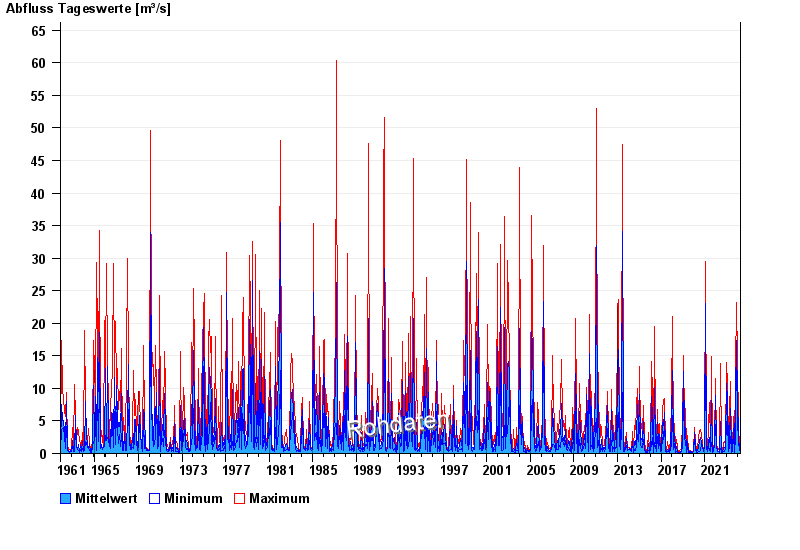
| Date | Mean value [m³/s] | Maximum [m³/s] | Minimum [m³/s] |
|---|---|---|---|
| 18.04.2024 | 0.524 | 0.567 | 0.462 |
| 17.04.2024 | 0.423 | 0.625 | 0.291 |
| 16.04.2024 | 0.361 | 0.625 | 0.256 |
| 15.04.2024 | 0.396 | 0.567 | 0.256 |
| 14.04.2024 | 0.288 | 0.291 | 0.256 |
| 13.04.2024 | 0.287 | 0.291 | 0.256 |
| 12.04.2024 | 0.28 | 0.291 | 0.256 |
© Bayerisches Landesamt für Umwelt 2024