

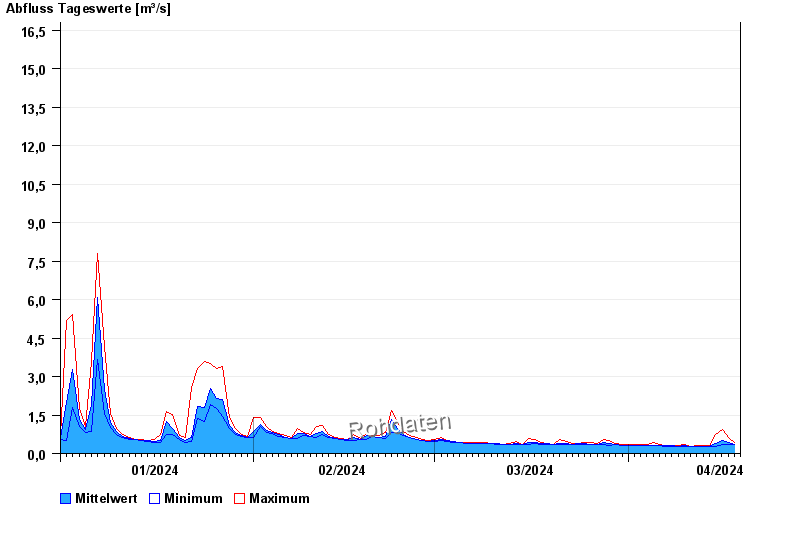
Chart of year Kollbach / Kollbach
Discharge from 01.01.2024 to 18.04.2024
- HQ1 25 m³/s
- HQ2 32 m³/s
- HQ5 35 m³/s
- HQ10 45 m³/s
- HQ20 57 m³/s
- HQ50 72 m³/s
- HQ100 90 m³/s
| Date | Mean value [m³/s] | Maximum [m³/s] | Minimum [m³/s] |
|---|---|---|---|
| 18.04.2024 | 0.392 | 0.429 | 0.333 |
| 17.04.2024 | 0.413 | 0.617 | 0.333 |
| 16.04.2024 | 0.492 | 0.922 | 0.333 |
| 15.04.2024 | 0.383 | 0.742 | 0.277 |
| 14.04.2024 | 0.278 | 0.304 | 0.277 |
| 13.04.2024 | 0.283 | 0.304 | 0.277 |
| 12.04.2024 | 0.28 | 0.304 | 0.277 |
© Bayerisches Landesamt für Umwelt 2024