

Chart of total period Ilsank / Ramsauer Ache
Discharge from 01.11.1930 to 18.04.2024
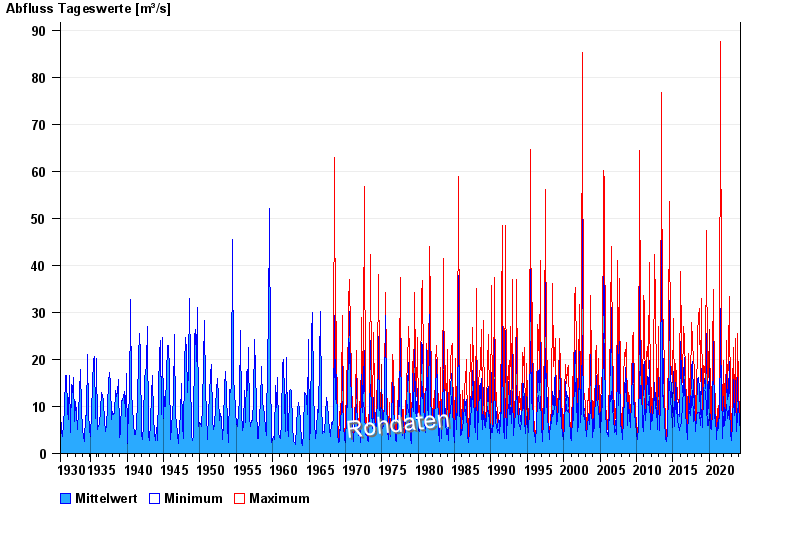
| Date | Mean value [m³/s] | Maximum [m³/s] | Minimum [m³/s] |
|---|---|---|---|
| 18.04.2024 | 6.01 | 6.25 | 5.89 |
| 17.04.2024 | 6.38 | 6.63 | 6.25 |
| 16.04.2024 | 8.67 | 10.5 | 6.63 |
| 15.04.2024 | 6.82 | 8.27 | 6.63 |
| 14.04.2024 | 6.41 | 7.02 | 6.25 |
| 13.04.2024 | 5.95 | 6.63 | 5.89 |
| 12.04.2024 | 5.56 | 5.89 | 5.21 |
© Bayerisches Landesamt für Umwelt 2024