

Chart of year Hochberg / Traun
Discharge from 03.04.2023 to 02.04.2024
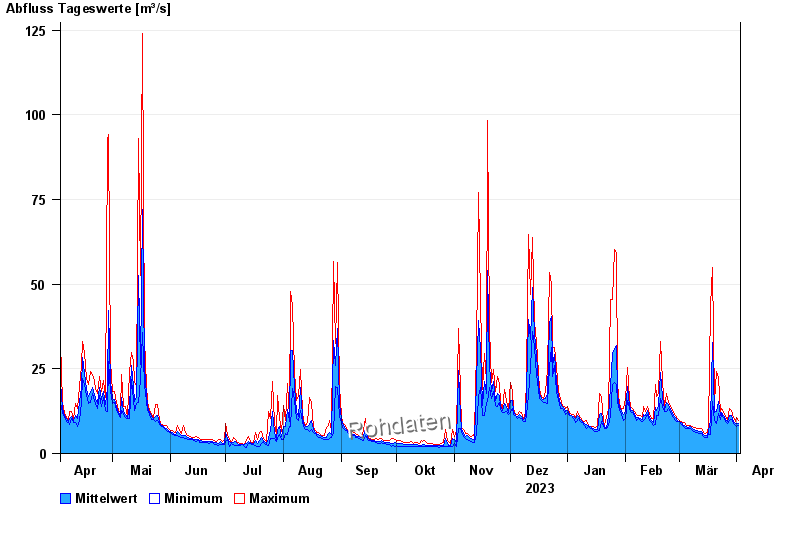
| Date | Mean value [m³/s] | Maximum [m³/s] | Minimum [m³/s] |
|---|---|---|---|
| 02.04.2024 | 8.94 | 9.74 | 8.22 |
| 01.04.2024 | 8.86 | 10.6 | 7.88 |
| 31.03.2024 | 8.75 | 9.34 | 8.22 |
| 30.03.2024 | 9.57 | 10.6 | 8.95 |
| 29.03.2024 | 11.2 | 12.7 | 10.1 |
| 28.03.2024 | 11.2 | 13.2 | 9.74 |
| 27.03.2024 | 9.49 | 9.74 | 8.95 |
© Bayerisches Landesamt für Umwelt 2024