

Chart of total period Hochberg / Traun
Discharge from 01.11.1968 to 19.04.2024
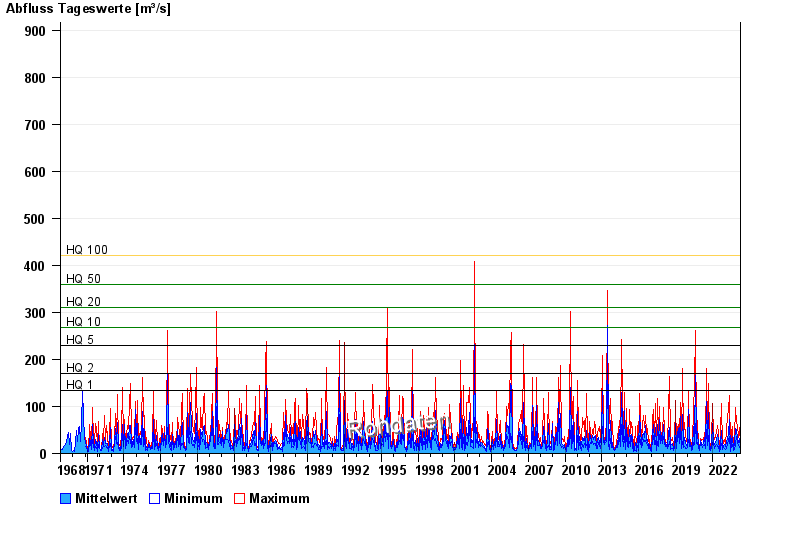
- HQ1 135 m³/s
- HQ2 170 m³/s
- HQ5 229 m³/s
- HQ10 267 m³/s
- HQ20 311 m³/s
- HQ50 360 m³/s
- HQ100 420 m³/s
| Date | Mean value [m³/s] | Maximum [m³/s] | Minimum [m³/s] |
|---|---|---|---|
| 19.04.2024 | 9.48 | 10.6 | 8.95 |
| 18.04.2024 | 9.74 | 11.8 | 8.22 |
| 17.04.2024 | 7.02 | 9.74 | 5.02 |
| 16.04.2024 | 5.83 | 6.51 | 5.3 |
| 15.04.2024 | 5.91 | 7.18 | 5.02 |
| 14.04.2024 | 5.63 | 6.51 | 3.99 |
| 13.04.2024 | 5.89 | 6.51 | 5.3 |
© Bayerisches Landesamt für Umwelt 2024