
- Start >
- Rivers >
- Discharge >
- Inn >
- Großschwindau >
- Chart of year

Chart of year Großschwindau / Goldach
Discharge from 01.01.2024 to 19.04.2024
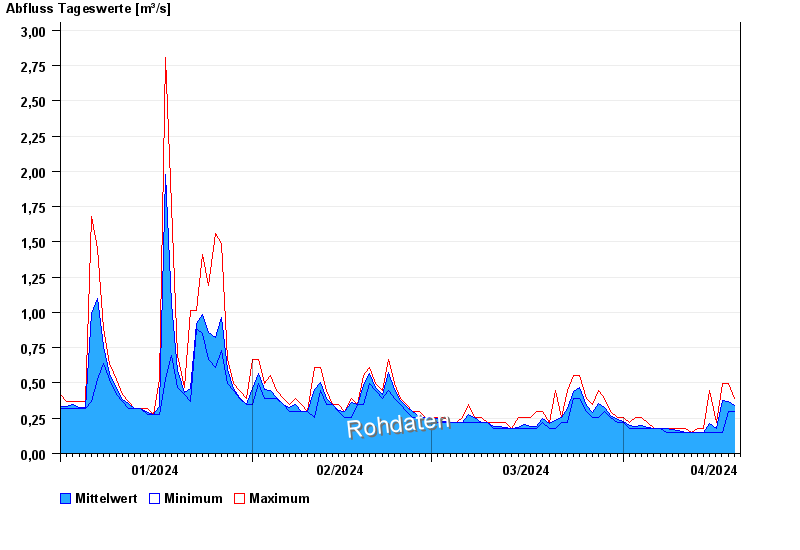
| Date | Mean value [m³/s] | Maximum [m³/s] | Minimum [m³/s] |
|---|---|---|---|
| 19.04.2024 | 0.345 | 0.345 | 0.345 |
| 18.04.2024 | 0.371 | 0.498 | 0.3 |
| 17.04.2024 | 0.377 | 0.498 | 0.147 |
| 16.04.2024 | 0.179 | 0.218 | 0.147 |
| 15.04.2024 | 0.214 | 0.445 | 0.147 |
| 14.04.2024 | 0.148 | 0.18 | 0.147 |
| 13.04.2024 | 0.151 | 0.18 | 0.147 |
© Bayerisches Landesamt für Umwelt 2024