
- Start >
- Rivers >
- Discharge >
- Inn >
- Großschwindau >
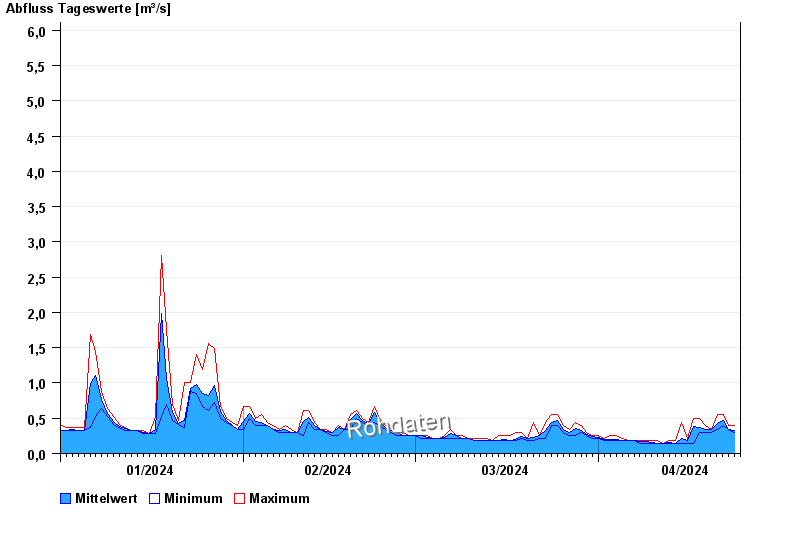
- Chart of year

Chart of year Großschwindau / Goldach
Discharge from 01.01.2024 to 24.04.2024
- HQ1 8,8 m³/s
- HQ2 11 m³/s
- HQ5 15 m³/s
- HQ10 19 m³/s
- HQ20 22 m³/s
- HQ50 26 m³/s
- HQ100 29 m³/s
| Date | Mean value [m³/s] | Maximum [m³/s] | Minimum [m³/s] |
|---|---|---|---|
| 24.04.2024 | 0.345 | 0.345 | 0.345 |
| 23.04.2024 | 0.347 | 0.393 | 0.345 |
| 22.04.2024 | 0.462 | 0.553 | 0.393 |
| 21.04.2024 | 0.42 | 0.553 | 0.345 |
| 20.04.2024 | 0.334 | 0.345 | 0.3 |
| 19.04.2024 | 0.337 | 0.393 | 0.3 |
| 18.04.2024 | 0.371 | 0.498 | 0.3 |
© Bayerisches Landesamt für Umwelt 2024