

Chart of year Gaißach / Große Gaißach
Discharge from 04.08.2019 to 03.08.2020
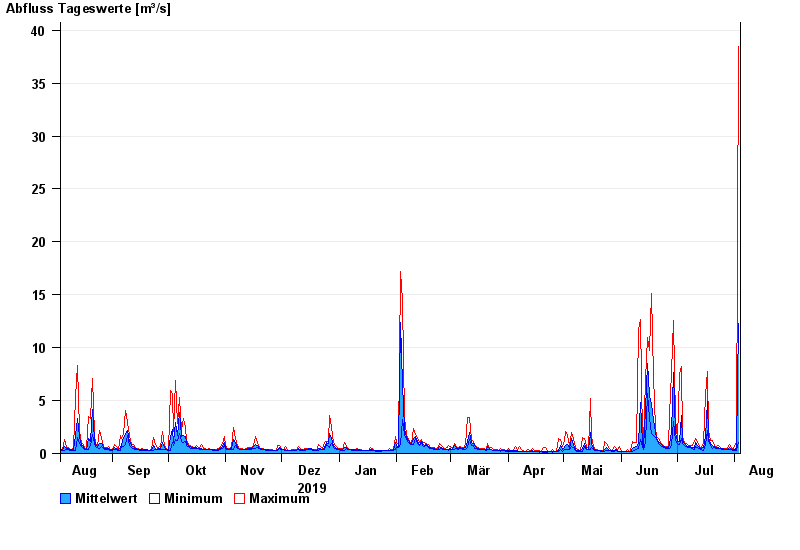
| Date | Mean value [m³/s] | Maximum [m³/s] | Minimum [m³/s] |
|---|---|---|---|
| 03.08.2020 | 12.3 | 38.5 | 0.993 |
| 02.08.2020 | 0.587 | 1.18 | 0.306 |
| 01.08.2020 | 0.358 | 0.812 | 0.24 |
| 31.07.2020 | 0.363 | 0.448 | 0.269 |
| 30.07.2020 | 0.408 | 0.446 | 0.345 |
| 29.07.2020 | 0.548 | 0.889 | 0.389 |
| 28.07.2020 | 0.389 | 0.503 | 0.341 |
© Bayerisches Landesamt für Umwelt 2024