

Chart of total period Gaißach / Große Gaißach
Discharge from 01.11.1955 to 25.04.2024
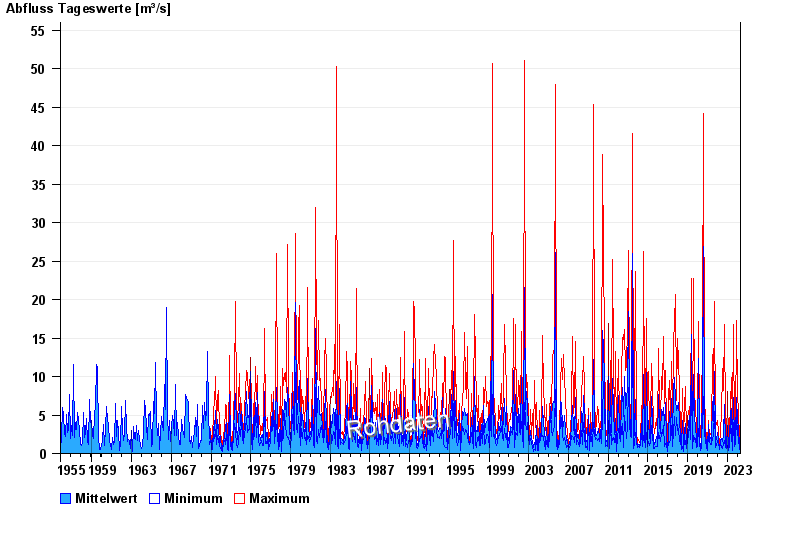
| Date | Mean value [m³/s] | Maximum [m³/s] | Minimum [m³/s] |
|---|---|---|---|
| 25.04.2024 | 0.594 | 0.706 | 0.507 |
| 24.04.2024 | 0.601 | 0.706 | 0.507 |
| 23.04.2024 | 0.672 | 0.706 | 0.634 |
| 22.04.2024 | 0.788 | 1.04 | 0.634 |
| 21.04.2024 | 0.867 | 1.04 | 0.706 |
| 20.04.2024 | 1.1 | 1.35 | 0.862 |
| 19.04.2024 | 0.647 | 1.24 | 0.452 |
© Bayerisches Landesamt für Umwelt 2024