
- Start >
- Rivers >
- Discharge >
- Inn >
- Feldolling >
- Chart of year

Chart of year Feldolling / Mangfall
Discharge from 16.12.2019 to 15.12.2020
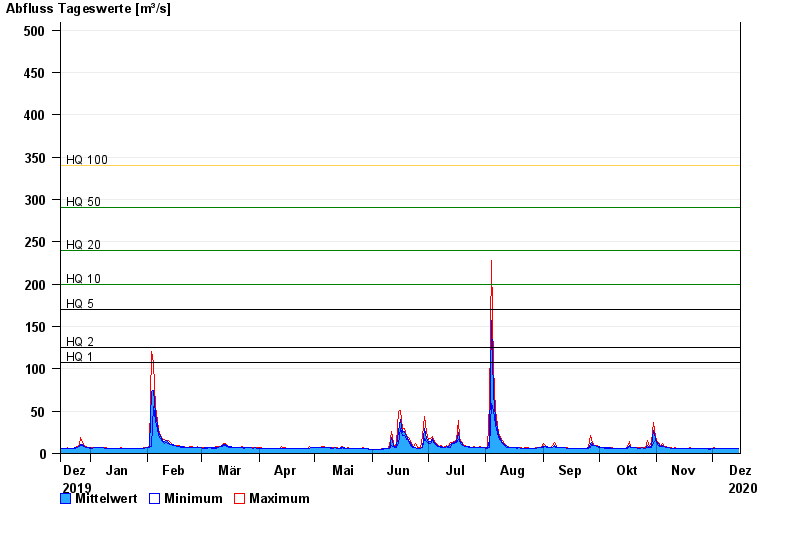
- HQ1 108 m³/s
- HQ2 125 m³/s
- HQ5 170 m³/s
- HQ10 200 m³/s
- HQ20 240 m³/s
- HQ50 290 m³/s
- HQ100 340 m³/s
| Date | Mean value [m³/s] | Maximum [m³/s] | Minimum [m³/s] |
|---|---|---|---|
| 15.12.2020 | 5.92 | 5.93 | 5.92 |
| 14.12.2020 | 5.92 | 5.92 | 5.92 |
| 13.12.2020 | 5.92 | 5.92 | 5.92 |
| 12.12.2020 | 5.92 | 5.92 | 5.92 |
| 11.12.2020 | 5.91 | 5.92 | 5.91 |
| 10.12.2020 | 5.91 | 5.91 | 5.91 |
| 09.12.2020 | 5.91 | 5.91 | 5.91 |
© Bayerisches Landesamt für Umwelt 2024