
- Start >
- Rivers >
- Discharge >
- Inn >
- Feldolling >
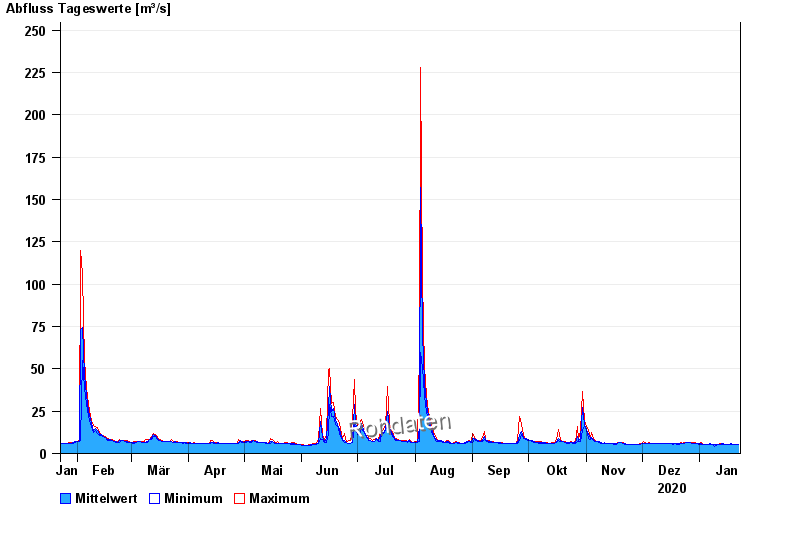
- Chart of year

Chart of year Feldolling / Mangfall
Discharge from 23.01.2020 to 22.01.2021
| Date | Mean value [m³/s] | Maximum [m³/s] | Minimum [m³/s] |
|---|---|---|---|
| 22.01.2021 | 5.61 | 5.61 | 5.61 |
| 21.01.2021 | 5.61 | 5.61 | 5.61 |
| 20.01.2021 | 5.61 | 5.61 | 5.61 |
| 19.01.2021 | 5.61 | 5.61 | 5.61 |
| 18.01.2021 | 5.63 | 5.95 | 5.61 |
| 17.01.2021 | 5.61 | 5.61 | 5.61 |
| 16.01.2021 | 5.61 | 5.61 | 5.61 |
© Bayerisches Landesamt für Umwelt 2024