
- Start >
- Rivers >
- Discharge >
- Inn >
- Feldolling >
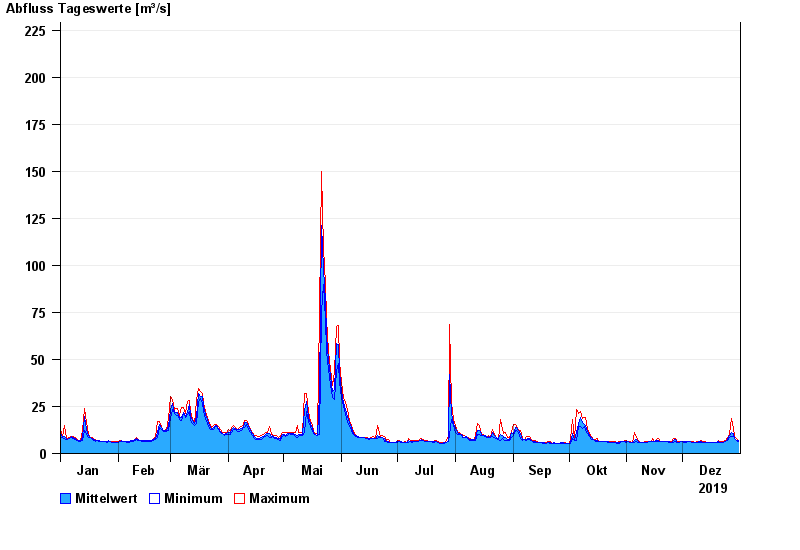
- Chart of year

Chart of year Feldolling / Mangfall
Discharge from 01.01.2019 to 31.12.2019
- 07.07.1946 Abfluss: 294 m³/s
- 31.05.1940 Abfluss: 289 m³/s
- 02.06.2013 Abfluss: 288 m³/s
- 09.07.1954 Abfluss: 272 m³/s
- 22.05.1999 Abfluss: 254 m³/s
| Date | Mean value [m³/s] | Maximum [m³/s] | Minimum [m³/s] |
|---|---|---|---|
| 31.12.2019 | 6.66 | 6.94 | 6.55 |
| 30.12.2019 | 7.12 | 7.76 | 6.94 |
| 29.12.2019 | 8.22 | 9.12 | 7.76 |
| 28.12.2019 | 10.4 | 13.4 | 9.12 |
| 27.12.2019 | 11 | 18.4 | 9.12 |
| 26.12.2019 | 9.5 | 10.1 | 8.65 |
| 25.12.2019 | 7.32 | 8.65 | 6.94 |
© Bayerisches Landesamt für Umwelt 2024