
- Start >
- Rivers >
- Discharge >
- Inn >
- Feldolling >
- Chart of year

Chart of year Feldolling / Mangfall
Discharge from 22.02.2020 to 21.02.2021
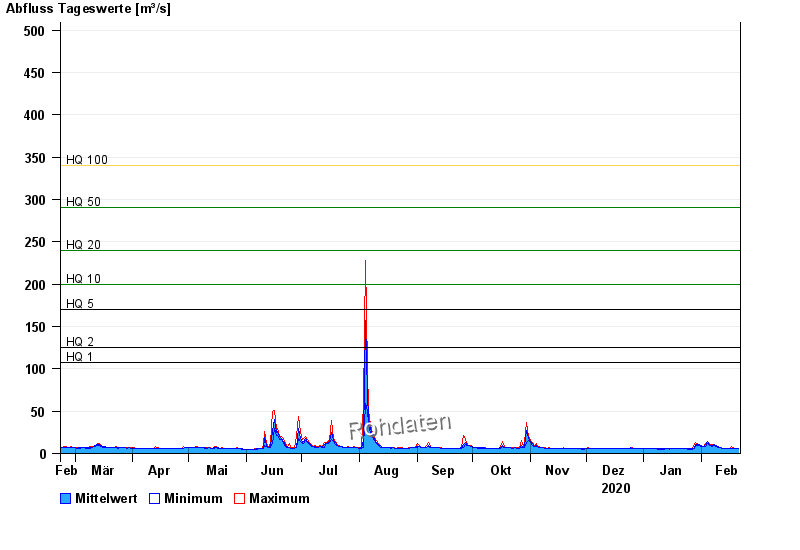
- HQ1 108 m³/s
- HQ2 125 m³/s
- HQ5 170 m³/s
- HQ10 200 m³/s
- HQ20 240 m³/s
- HQ50 290 m³/s
- HQ100 340 m³/s
| Date | Mean value [m³/s] | Maximum [m³/s] | Minimum [m³/s] |
|---|---|---|---|
| 21.02.2021 | 5.95 | 5.95 | 5.95 |
| 20.02.2021 | 5.95 | 5.95 | 5.95 |
| 19.02.2021 | 5.97 | 6.31 | 5.95 |
| 18.02.2021 | 6.31 | 6.69 | 5.95 |
| 17.02.2021 | 6.47 | 8.34 | 5.95 |
| 16.02.2021 | 5.95 | 5.95 | 5.95 |
| 15.02.2021 | 5.84 | 6.31 | 5.61 |
© Bayerisches Landesamt für Umwelt 2024