
- Start >
- Rivers >
- Discharge >
- Inn >
- Erlachleiten >
- Chart of total period

Chart of total period Erlachleiten / Erlau
Discharge from 24.06.2008 to 18.04.2024
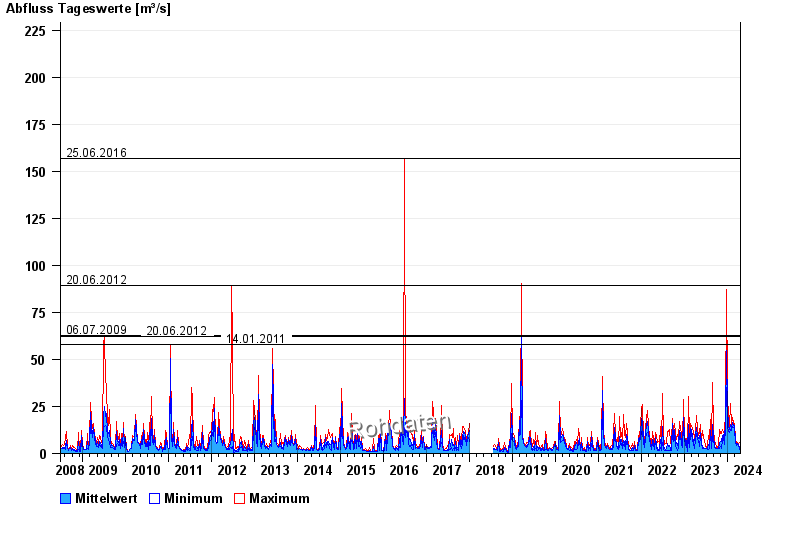
- 20.06.2012 Abfluss: 89,1 m³/s
- 06.07.2009 Abfluss: 62,5 m³/s
- 14.01.2011 Abfluss: 58 m³/s
- 27.06.2009 Abfluss: 57,7 m³/s
- 02.06.2013 Abfluss: 55,8 m³/s
| Date | Mean value [m³/s] | Maximum [m³/s] | Minimum [m³/s] |
|---|---|---|---|
| 18.04.2024 | 5.08 | 5.47 | 4.6 |
| 17.04.2024 | 3.51 | 5.02 | 2.62 |
| 16.04.2024 | 2.91 | 3.8 | 2.34 |
| 15.04.2024 | 2.85 | 4.6 | 2.08 |
| 14.04.2024 | 2.37 | 3.61 | 1.85 |
| 13.04.2024 | 2.28 | 2.77 | 1.96 |
| 12.04.2024 | 2.55 | 5.93 | 1.85 |
© Bayerisches Landesamt für Umwelt 2024