

Chart of year Engfurt / Isen
Discharge from 01.01.2020 to 31.12.2020
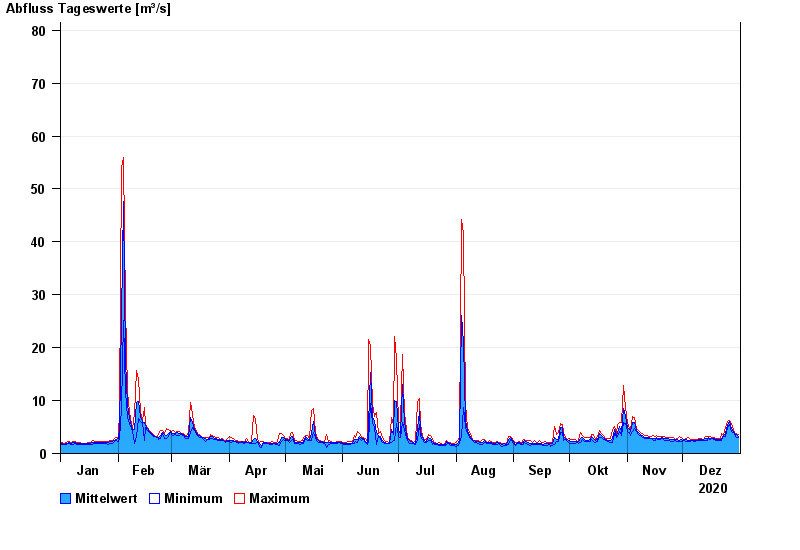
note
zeitweise Beeinflussung durch Kraftwerksbetrieb möglich
- 09.07.1954 Abfluss: 265 m³/s
- 02.02.1985 Abfluss: 173 m³/s
- 31.01.1982 Abfluss: 141 m³/s
- 16.01.1968 Abfluss: 138 m³/s
- 03.08.1991 Abfluss: 136 m³/s
| Date | Mean value [m³/s] | Maximum [m³/s] | Minimum [m³/s] |
|---|---|---|---|
| 31.12.2020 | 3.27 | 3.5 | 2.94 |
| 30.12.2020 | 3.55 | 3.82 | 2.93 |
| 29.12.2020 | 3.8 | 3.98 | 3.5 |
| 28.12.2020 | 4.21 | 4.5 | 3.97 |
| 27.12.2020 | 4.79 | 5.68 | 4.14 |
| 26.12.2020 | 5.96 | 6.33 | 5.47 |
| 25.12.2020 | 5.49 | 6.1 | 4.67 |
© Bayerisches Landesamt für Umwelt 2024