

Chart of year Engfurt / Isen
Discharge from 01.01.2024 to 18.04.2024
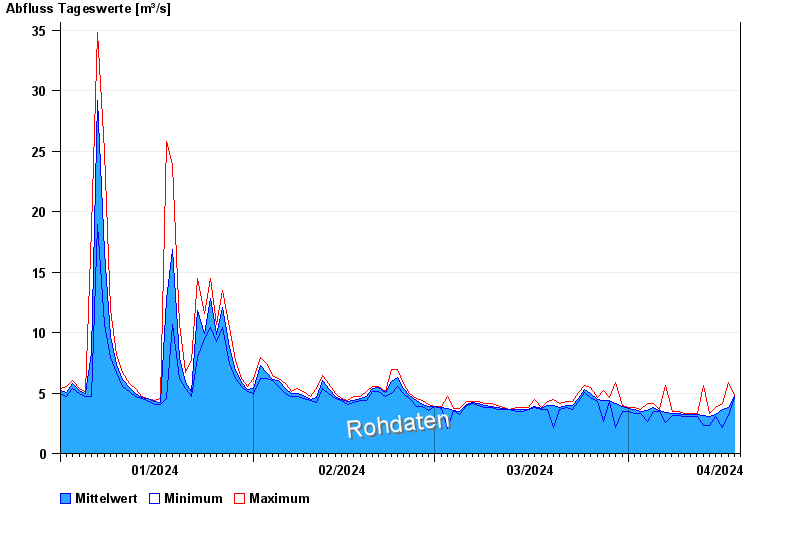
note
zeitweise Beeinflussung durch Kraftwerksbetrieb möglich
| Date | Mean value [m³/s] | Maximum [m³/s] | Minimum [m³/s] |
|---|---|---|---|
| 18.04.2024 | 4.74 | 4.82 | 4.64 |
| 17.04.2024 | 3.84 | 5.84 | 3.17 |
| 16.04.2024 | 3.65 | 4.1 | 2.11 |
| 15.04.2024 | 3.23 | 3.77 | 3.03 |
| 14.04.2024 | 3.07 | 3.31 | 2.31 |
| 13.04.2024 | 3.16 | 5.62 | 2.31 |
| 12.04.2024 | 3.19 | 3.31 | 3.03 |
© Bayerisches Landesamt für Umwelt 2024