

Chart of year Engfurt / Isen
Discharge from 16.06.2021 to 15.06.2022
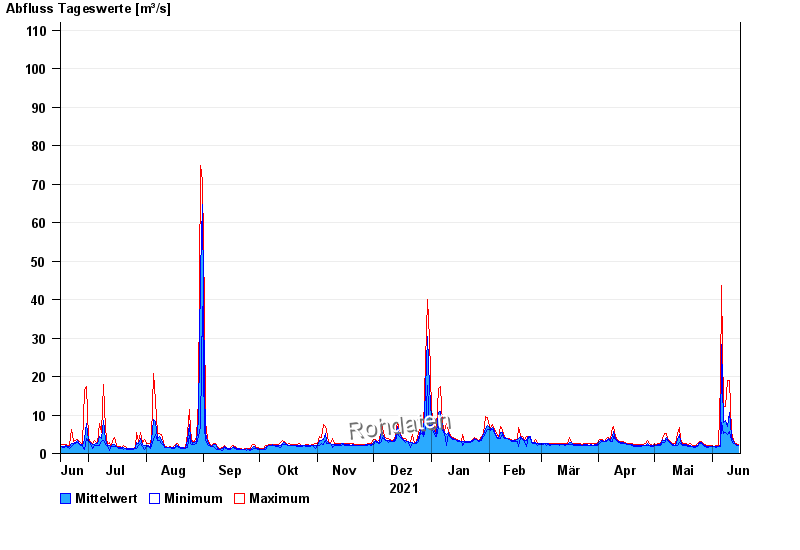
note
zeitweise Beeinflussung durch Kraftwerksbetrieb möglich
- 09.07.1954 Abfluss: 265 m³/s
- 02.02.1985 Abfluss: 173 m³/s
- 31.01.1982 Abfluss: 141 m³/s
- 16.01.1968 Abfluss: 138 m³/s
- 03.08.1991 Abfluss: 136 m³/s
| Date | Mean value [m³/s] | Maximum [m³/s] | Minimum [m³/s] |
|---|---|---|---|
| 15.06.2022 | 2.12 | 2.25 | 1.96 |
| 14.06.2022 | 2.43 | 2.7 | 2.15 |
| 13.06.2022 | 2.69 | 2.82 | 2.59 |
| 12.06.2022 | 3.01 | 3.36 | 2.7 |
| 11.06.2022 | 4.44 | 5.47 | 3.36 |
| 10.06.2022 | 10.7 | 18.9 | 5.68 |
| 09.06.2022 | 6.92 | 18.9 | 4.88 |
© Bayerisches Landesamt für Umwelt 2024