
- Start >
- Rivers >
- Discharge >
- Inn >
- Burghausen >
- Chart of year

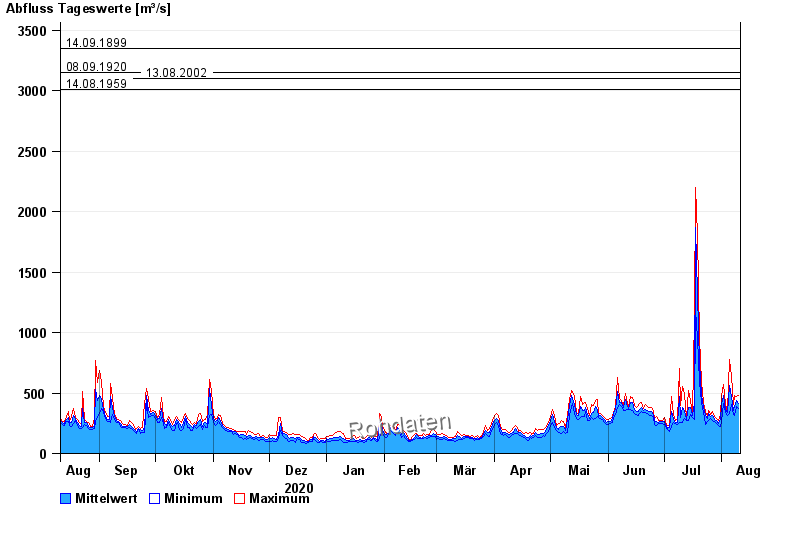
Chart of year Burghausen / Salzach
Discharge from 11.08.2020 to 10.08.2021
- 03.06.2013 Abfluss: 4000 m³/s
- 14.09.1899 Abfluss: 3350 m³/s
- 08.09.1920 Abfluss: 3150 m³/s
- 13.08.2002 Abfluss: 3100 m³/s
- 14.08.1959 Abfluss: 3010 m³/s
| Date | Mean value [m³/s] | Maximum [m³/s] | Minimum [m³/s] |
|---|---|---|---|
| 10.08.2021 | 410 | 476 | 373 |
| 09.08.2021 | 436 | 473 | 392 |
| 08.08.2021 | 391 | 479 | 318 |
| 07.08.2021 | 356 | 408 | 323 |
| 06.08.2021 | 471 | 639 | 408 |
| 05.08.2021 | 559 | 775 | 332 |
| 04.08.2021 | 336 | 345 | 318 |
© Bayerisches Landesamt für Umwelt 2024