
- Start >
- Rivers >
- Discharge >
- Inn >
- Burghausen >
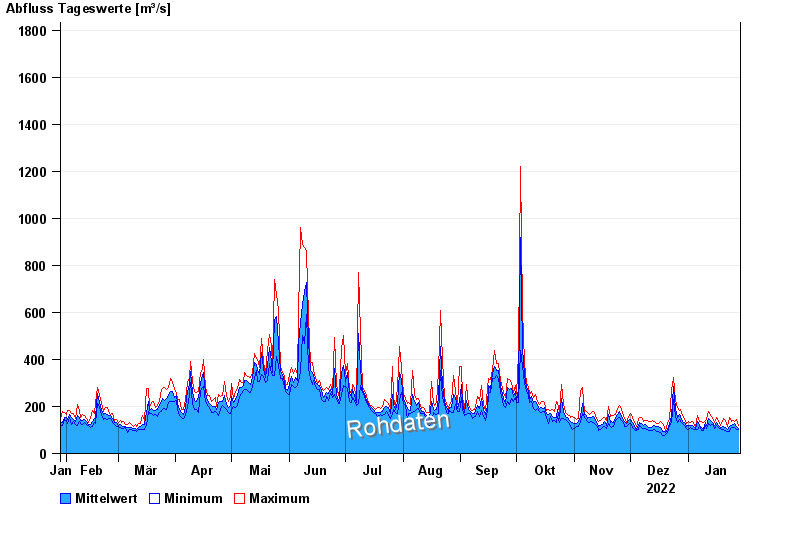
- Chart of year

Chart of year Burghausen / Salzach
Discharge from 29.01.2022 to 28.01.2023
- 03.06.2013 Abfluss: 4000 m³/s
- 14.09.1899 Abfluss: 3350 m³/s
- 08.09.1920 Abfluss: 3150 m³/s
- 13.08.2002 Abfluss: 3100 m³/s
- 14.08.1959 Abfluss: 3010 m³/s
| Date | Mean value [m³/s] | Maximum [m³/s] | Minimum [m³/s] |
|---|---|---|---|
| 28.01.2023 | 108 | 117 | 101 |
| 27.01.2023 | 115 | 144 | 101 |
| 26.01.2023 | 127 | 138 | 110 |
| 25.01.2023 | 124 | 142 | 109 |
| 24.01.2023 | 121 | 137 | 109 |
| 23.01.2023 | 114 | 151 | 94.5 |
| 22.01.2023 | 104 | 116 | 94.5 |
© Bayerisches Landesamt für Umwelt 2024