
- Start >
- Rivers >
- Discharge >
- Inn >
- Burghausen >
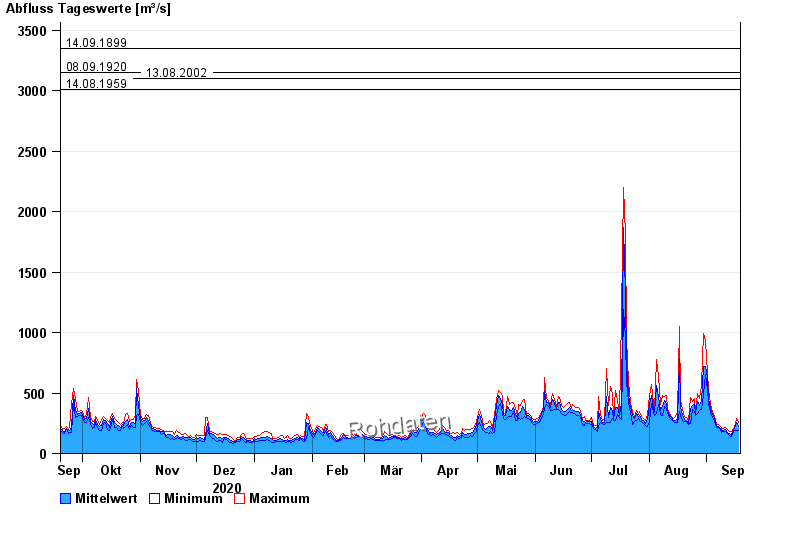
- Chart of year

Chart of year Burghausen / Salzach
Discharge from 19.09.2020 to 18.09.2021
- 03.06.2013 Abfluss: 4000 m³/s
- 14.09.1899 Abfluss: 3350 m³/s
- 08.09.1920 Abfluss: 3150 m³/s
- 13.08.2002 Abfluss: 3100 m³/s
- 14.08.1959 Abfluss: 3010 m³/s
| Date | Mean value [m³/s] | Maximum [m³/s] | Minimum [m³/s] |
|---|---|---|---|
| 18.09.2021 | 220 | 260 | 192 |
| 17.09.2021 | 254 | 287 | 192 |
| 16.09.2021 | 203 | 217 | 190 |
| 15.09.2021 | 190 | 210 | 173 |
| 14.09.2021 | 161 | 179 | 143 |
| 13.09.2021 | 163 | 181 | 149 |
| 12.09.2021 | 175 | 197 | 162 |
© Bayerisches Landesamt für Umwelt 2024