
- Start >
- Rivers >
- Discharge >
- Inn >
- Bad Wiessee >
- Chart of month

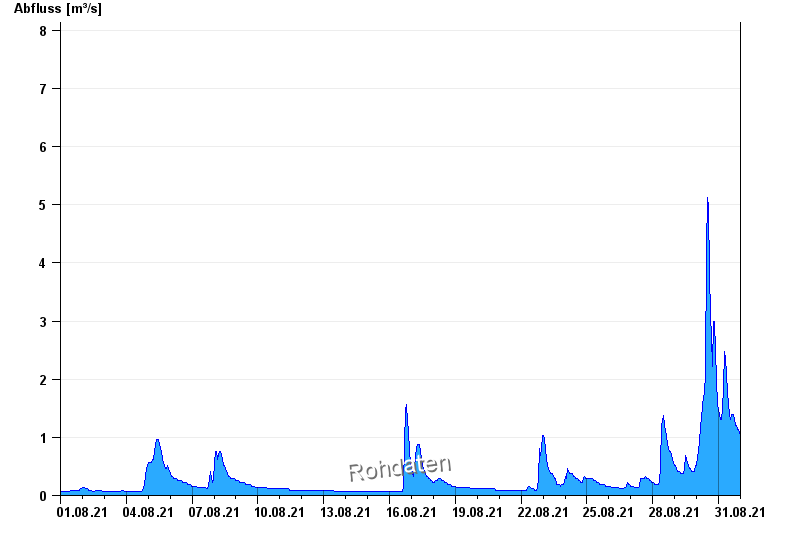
Chart of month Bad Wiessee / Zeiselbach
Discharge from 01.08.2021 to 31.08.2021
- 10.06.1993 Abfluss: 16 m³/s
- 30.06.1990 Abfluss: 10,1 m³/s
- 13.06.2014 Abfluss: 9,54 m³/s
- 21.05.1999 Abfluss: 9,06 m³/s
- 02.06.2013 Abfluss: 8,89 m³/s
| Date | Runoff [m³/s] |
|---|---|
| 01.09.2021 00:45 | 0.98 |
| 01.09.2021 00:30 | 0.98 |
| 01.09.2021 00:15 | 0.98 |
| 01.09.2021 00:00 | 0.98 |
| 31.08.2021 23:45 | 1.06 |
| 31.08.2021 23:30 | 1.06 |
| 31.08.2021 23:15 | 1.06 |
© Bayerisches Landesamt für Umwelt 2024