

Chart of total period Bad Tölz / Ellbach
Discharge from 01.11.1934 to 25.04.2024
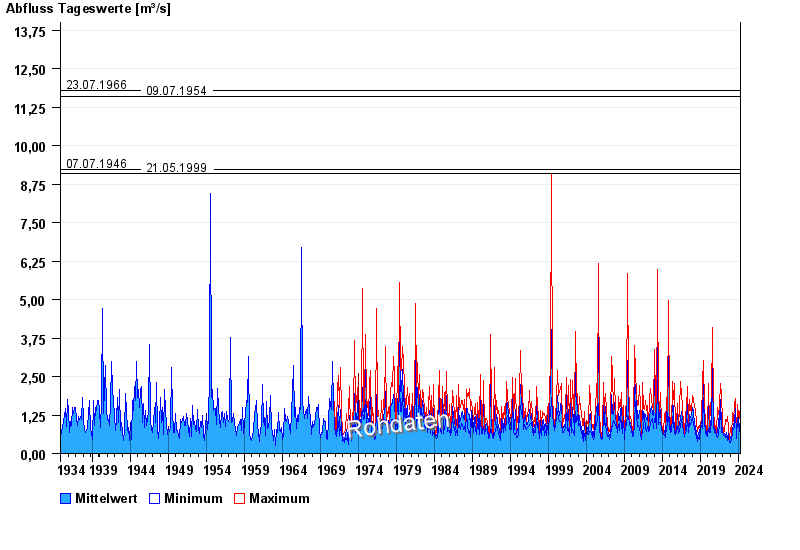
- 30.05.1940 Abfluss: 19,8 m³/s
- 23.07.1966 Abfluss: 11,8 m³/s
- 09.07.1954 Abfluss: 11,6 m³/s
- 07.07.1946 Abfluss: 9,23 m³/s
- 21.05.1999 Abfluss: 9,1 m³/s
| Date | Mean value [m³/s] | Maximum [m³/s] | Minimum [m³/s] |
|---|---|---|---|
| 25.04.2024 | 0.701 | 0.73 | 0.657 |
| 24.04.2024 | 0.733 | 0.769 | 0.693 |
| 23.04.2024 | 0.739 | 0.769 | 0.73 |
| 22.04.2024 | 0.735 | 0.769 | 0.693 |
| 21.04.2024 | 0.78 | 0.811 | 0.73 |
| 20.04.2024 | 0.802 | 0.853 | 0.769 |
| 19.04.2024 | 0.748 | 0.769 | 0.693 |
© Bayerisches Landesamt für Umwelt 2024