
- Start >
- Rivers >
- Discharge >
- Inn >
- Bad Aibling Q >
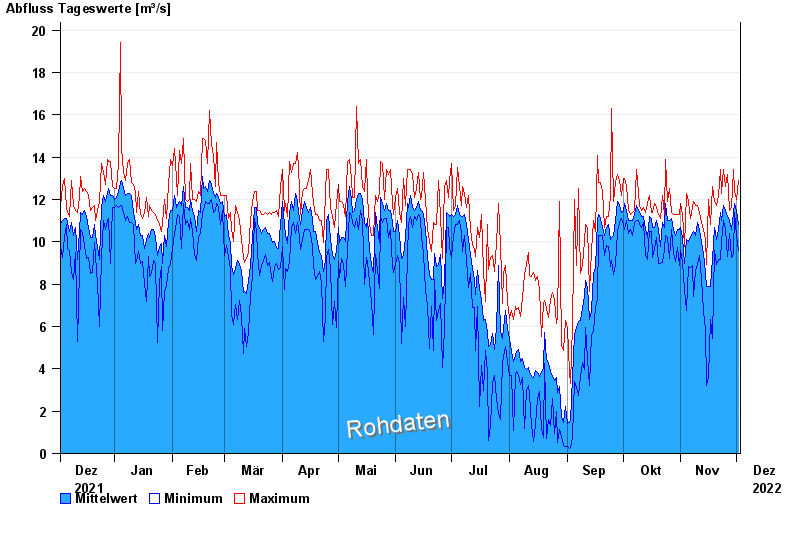
- Chart of year

Chart of year Bad Aibling Q / Triftbach
Discharge from 03.12.2021 to 02.12.2022
 Für diesen Pegel sind keine Hauptwerte hinterlegt.
note
Schneefall kann die Messdaten verfälschen.
| Date | Mean value [m³/s] | Maximum [m³/s] | Minimum [m³/s] |
|---|---|---|---|
| 02.12.2022 | 10.8 | 12.9 | 9.57 |
| 01.12.2022 | 11.5 | 12 | 10.3 |
| 30.11.2022 | 11.8 | 12.4 | 11.4 |
| 29.11.2022 | 11.4 | 13.4 | 9.38 |
| 28.11.2022 | 10.6 | 11.6 | 9.27 |
| 27.11.2022 | 11 | 11.5 | 10.4 |
| 26.11.2022 | 11.2 | 13.2 | 9.3 |
© Bayerisches Landesamt für Umwelt 2024