

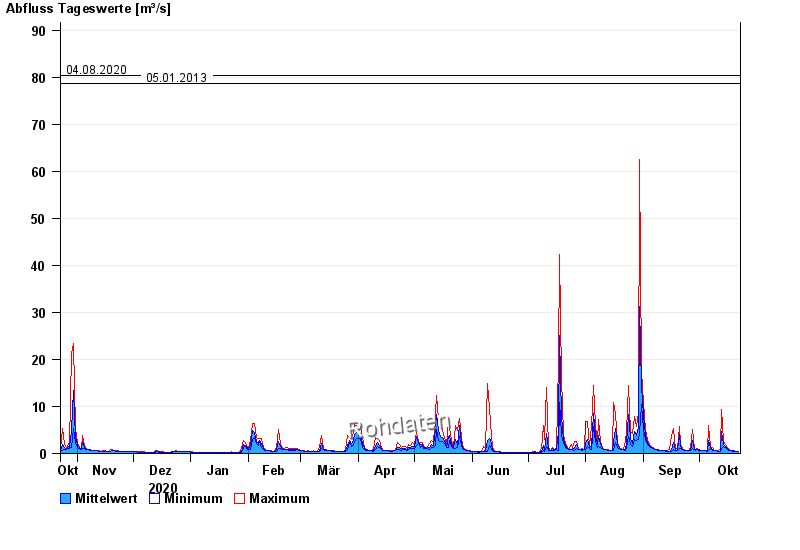
Chart of year Aschau / Prien
Discharge from 23.10.2020 to 22.10.2021
- 01.06.2013 Abfluss: 128 m³/s
- 12.08.2002 Abfluss: 110 m³/s
- 03.06.2010 Abfluss: 98,3 m³/s
- 04.08.2020 Abfluss: 80,3 m³/s
- 05.01.2013 Abfluss: 78,6 m³/s
| Date | Mean value [m³/s] | Maximum [m³/s] | Minimum [m³/s] |
|---|---|---|---|
| 22.10.2021 | 0.431 | 0.431 | 0.431 |
| 21.10.2021 | 0.465 | 0.491 | 0.431 |
| 20.10.2021 | 0.492 | 0.556 | 0.491 |
| 19.10.2021 | 0.556 | 0.629 | 0.491 |
| 18.10.2021 | 0.618 | 0.629 | 0.556 |
| 17.10.2021 | 0.736 | 0.9 | 0.629 |
| 16.10.2021 | 1 | 1.26 | 0.9 |
© Bayerisches Landesamt für Umwelt 2024