

Chart of year Aschau / Prien
Discharge from 21.02.2020 to 20.02.2021
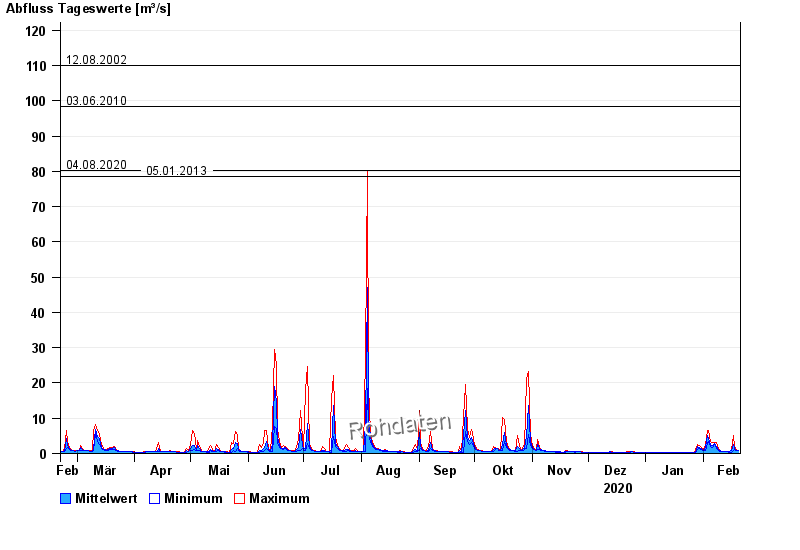
- 01.06.2013 Abfluss: 128 m³/s
- 12.08.2002 Abfluss: 110 m³/s
- 03.06.2010 Abfluss: 98,3 m³/s
- 04.08.2020 Abfluss: 80,3 m³/s
- 05.01.2013 Abfluss: 78,6 m³/s
| Date | Mean value [m³/s] | Maximum [m³/s] | Minimum [m³/s] |
|---|---|---|---|
| 20.02.2021 | 0.806 | 0.979 | 0.78 |
| 19.02.2021 | 0.876 | 1.09 | 0.78 |
| 18.02.2021 | 1.41 | 2.12 | 1.09 |
| 17.02.2021 | 2.63 | 5.05 | 0.979 |
| 16.02.2021 | 0.757 | 1.21 | 0.424 |
| 15.02.2021 | 0.446 | 0.48 | 0.424 |
| 14.02.2021 | 0.48 | 0.48 | 0.48 |
© Bayerisches Landesamt für Umwelt 2024