

Chart of year Aschau / Prien
Discharge from 29.07.2020 to 28.07.2021
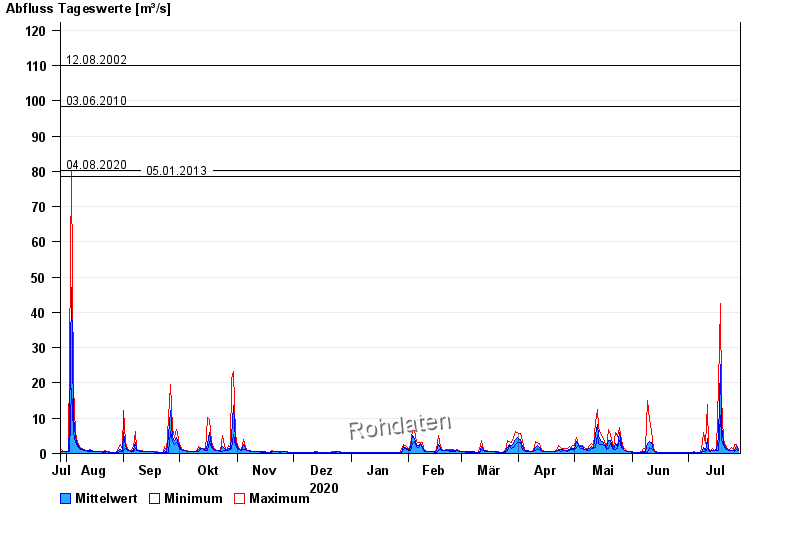
- 01.06.2013 Abfluss: 128 m³/s
- 12.08.2002 Abfluss: 110 m³/s
- 03.06.2010 Abfluss: 98,3 m³/s
- 04.08.2020 Abfluss: 80,3 m³/s
- 05.01.2013 Abfluss: 78,6 m³/s
| Date | Mean value [m³/s] | Maximum [m³/s] | Minimum [m³/s] |
|---|---|---|---|
| 28.07.2021 | 0.969 | 1.12 | 0.907 |
| 27.07.2021 | 1.93 | 2.55 | 1.12 |
| 26.07.2021 | 0.964 | 2.55 | 0.643 |
| 25.07.2021 | 0.957 | 1.25 | 0.81 |
| 24.07.2021 | 0.933 | 1.83 | 0.81 |
| 23.07.2021 | 0.95 | 1.01 | 0.907 |
| 22.07.2021 | 1.14 | 1.38 | 1.01 |
© Bayerisches Landesamt für Umwelt 2024