

Chart of year Aschau / Prien
Discharge from 18.11.2019 to 17.11.2020
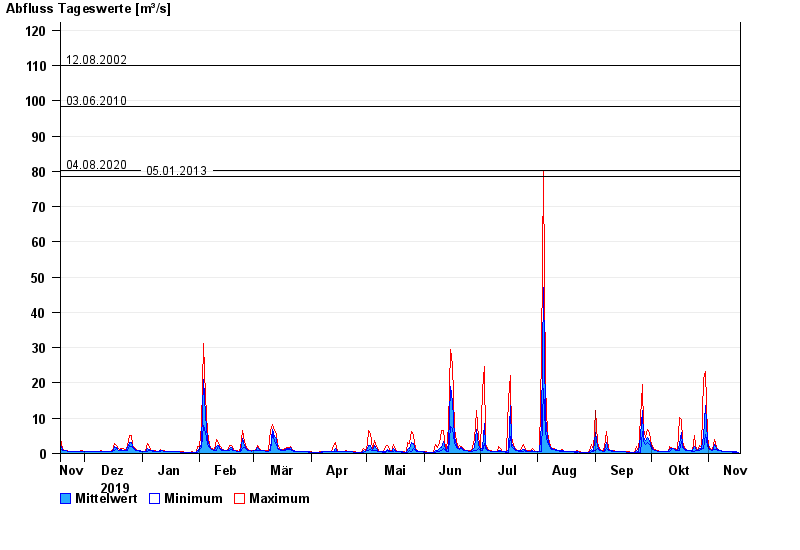
- 01.06.2013 Abfluss: 128 m³/s
- 12.08.2002 Abfluss: 110 m³/s
- 03.06.2010 Abfluss: 98,3 m³/s
- 04.08.2020 Abfluss: 80,3 m³/s
- 05.01.2013 Abfluss: 78,6 m³/s
| Date | Mean value [m³/s] | Maximum [m³/s] | Minimum [m³/s] |
|---|---|---|---|
| 17.11.2020 | 0.421 | 0.421 | 0.421 |
| 16.11.2020 | 0.473 | 0.552 | 0.42 |
| 15.11.2020 | 0.481 | 0.551 | 0.42 |
| 14.11.2020 | 0.481 | 0.482 | 0.42 |
| 13.11.2020 | 0.528 | 0.55 | 0.481 |
| 12.11.2020 | 0.549 | 0.549 | 0.548 |
| 11.11.2020 | 0.586 | 0.624 | 0.548 |
© Bayerisches Landesamt für Umwelt 2024