
- Start >
- Rivers >
- Discharge >
- Iller - Lech - Bodensee >
- Zwirkenberg >
- Chart of year

Chart of year Zwirkenberg / Obere Argen
Discharge from 01.01.2024 to 25.04.2024
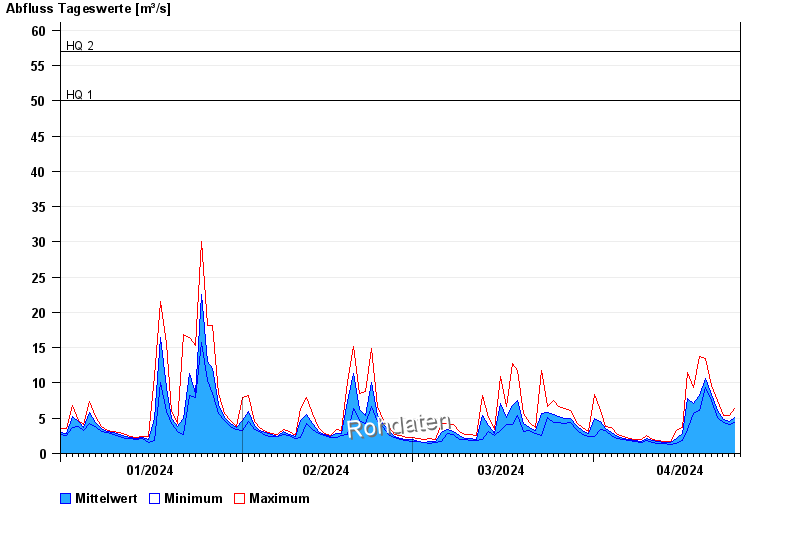
- HQ1 50 m³/s
- HQ2 57 m³/s
- HQ5 71 m³/s
- HQ10 83 m³/s
- HQ20 95 m³/s
- HQ50 110 m³/s
- HQ100 120 m³/s
| Date | Mean value [m³/s] | Maximum [m³/s] | Minimum [m³/s] |
|---|---|---|---|
| 25.04.2024 | 4.83 | 5.37 | 4.46 |
| 24.04.2024 | 4.59 | 5.37 | 4.04 |
| 23.04.2024 | 4.88 | 5.37 | 4.46 |
| 22.04.2024 | 6.09 | 7.52 | 5.14 |
| 21.04.2024 | 8.32 | 9.65 | 7.52 |
| 20.04.2024 | 10.6 | 13.4 | 9.35 |
| 19.04.2024 | 8.23 | 13.7 | 6.13 |
© Bayerisches Landesamt für Umwelt 2024