
- Start >
- Rivers >
- Discharge >
- Iller - Lech - Bodensee >
- Wittislingen >
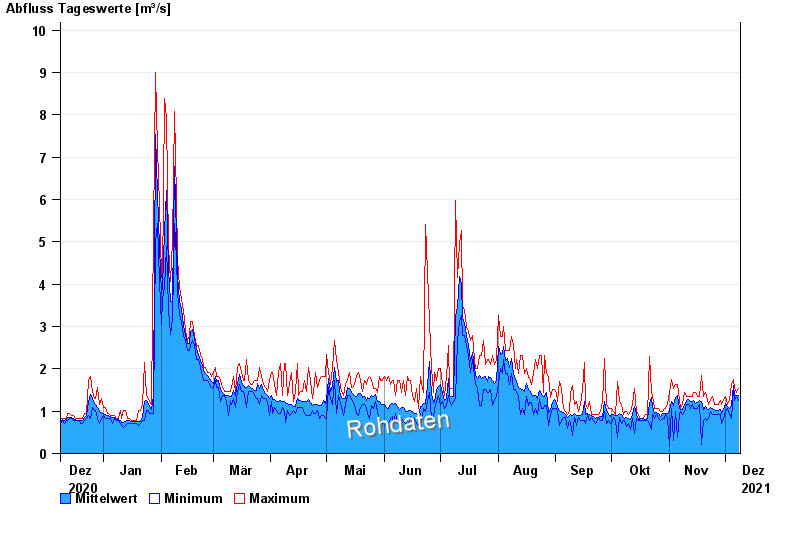
- Chart of year

Chart of year Wittislingen / Egau
Discharge from 09.12.2020 to 08.12.2021
| Date | Mean value [m³/s] | Maximum [m³/s] | Minimum [m³/s] |
|---|---|---|---|
| 08.12.2021 | 1.38 | 1.53 | 1.25 |
| 07.12.2021 | 1.38 | 1.44 | 1.34 |
| 06.12.2021 | 1.39 | 1.53 | 1.25 |
| 05.12.2021 | 1.61 | 1.74 | 1.53 |
| 04.12.2021 | 1.14 | 1.64 | 0.829 |
| 03.12.2021 | 1.07 | 1.25 | 0.913 |
| 02.12.2021 | 1.11 | 1.15 | 1.07 |
© Bayerisches Landesamt für Umwelt 2024