
- Start >
- Rivers >
- Discharge >
- Iller - Lech - Bodensee >
- Wittislingen >
- Chart of year

Chart of year Wittislingen / Egau
Discharge from 01.01.2024 to 20.04.2024
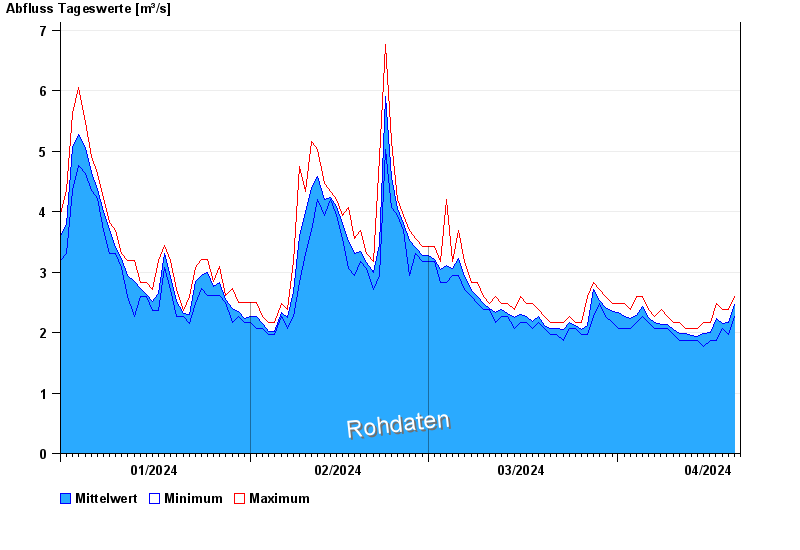
| Date | Mean value [m³/s] | Maximum [m³/s] | Minimum [m³/s] |
|---|---|---|---|
| 20.04.2024 | 2.49 | 2.6 | 2.38 |
| 19.04.2024 | 2.17 | 2.38 | 1.96 |
| 18.04.2024 | 2.15 | 2.38 | 2.06 |
| 17.04.2024 | 2.23 | 2.48 | 1.87 |
| 16.04.2024 | 2 | 2.16 | 1.87 |
| 15.04.2024 | 1.99 | 2.16 | 1.77 |
| 14.04.2024 | 1.93 | 2.06 | 1.87 |
© Bayerisches Landesamt für Umwelt 2024